Category: Transport

  • Energy group meeting notes (28.08.2025)

    Energy group meeting notes (28.08.2025)

    Next meeting 23rd October 19:00, online via Teams

    Here is what we covered:

    1. Domestic flexibility trials
    2. Local Plan GIS information
    3. Government Energy Strategy
    4. Car share scheme
    5. Electricity grid stats

    We went through the agenda quite quickly as there were only two of us.

    We decided to cancel the September in-person meeting, so the next online meeting is currently scheduled for the 23rd of October at 19:30. I’ll confirm this closer to the time if you are registered to receive ACT Energy group notifications.

    1. NESO has published it’s trials to explore how domestic customers respond to financial incentives to turn up/down their electricity use. Here is the report which highlight some interesting and not unexpected results, see the 5 bullet points.  It is a large sample of very mixed households, so a more representative cross-section of the UK population.
    2. The consultation on the changes made to the local plan following the inspector’s comments ends Oct. The energy group will not be responding as we do not believe we can effect further changes. TDC has accompanied this with an up dated map of the areas affected, see here.
    3. The government has published its Industrial strategy which included energy . Regen have provided a useful summary here and on the  flexibility strategy.
    4. It looks like E-Co Cars are planning a hub for Totnes, the presentation date has passed, but you can follow the concept here.
    5. Here is the  NESO monthly report for August. It’s good to see that 62% was generated from low carbon (not zero carbon as claimed) sources. If you are a user of our Carbon Footprint Tracker tool, the significant difference in Carbon Intensity is because NESO report CO2 not CO2e and only include territorial emissions of the fule usage. Also, these numbers represent one month rather than a full year.
  • Energy group meeting (31.07.2025)

    Energy group meeting (31.07.2025)

    next regular meetings will be:

    Next meeting 28th August 19:30 by zoom

    Here is what we covered when we met at the Teign Valley Community Hall:

    1. Carbon and energy reduction at the Teign Valley Community Hall
    2. Biofuel Watch
    3. Energy related planning policies, guidelines and strategies
    4. Learning about Climate Change, how to communicate for effective action
    5. More on grid battery charging, response from 3 industry experts & pumped hydro

    1. It was interesting to hear the background and process leading up to the major refurbishment of the TVCH’s heating and acoustics. You can read a summary of this in one of our case studies here, go to chapter 5.1 on page 14. This lead to some interesting discussions, including whether it was worth it. Specifically, the carbon and financial pay-back as well as the price of a tonne of avoided carbon.

      The numbers clearly show a significant 13.38t CO2e avoided each year, an impressive success. A saving of £2,623 per year at net present value is more modest, especially given the relatively high cost of the project. It was, however, pointed out that the improved comfort, the initial reason for the refurbishments, is not measured in financial pay-back, just like it isn’t when we buy a more comfortable mattress! As a comparison, the UK government’s central estimate for the value of CO2e in policy appraisal last year is £256 per tonne (based on 2020 prices over 30 years).

    2. Biofuelwatch say they “provides systemic analysis based on secondary and occasionally primary research and undertakes advocacy and campaigning in relation to the climate, environmental, human rights and public health impacts of large-scale industrial bioenergy.” In essence they are not in favour of any biomass use for energy generation, especially the most damaging like Drax.

      We have covered this topic a few times in the past, especially the question of whether burning biomass is carbon-neutral. Their FAQs make it clear the believe the answer is NO because “It can take years for that same amount of CO2 [when burnt] to be locked into biomass by a plant [sequestered]”. They then assert that “Biomass also emits more greenhouse gases per unit of energy than most fossil fuels.”,  a dubious claim based on the false premise that CO2 released from burning cannot be sequestered, the point they want to prove, a classic circular justification.

      Unsurprisingly, coal has about four times the calorific value of wood. Typically, and assuming sustainable wood supply, one cubic meter ~950kg of coal contains ~7,500 kWh of energy and would emit ~3,200 kg CO2e. To generate the same energy you’d need ~4.35t of wood logs emmiting ~177 kg of CO2e. These are consumption based emissions, so include mining/harvesting, processing and transport. Even the lowest Carbon Intensity fossil fuel, natural gas, would emit ~1,600 kg CO2e for the same energy, more than 10 times that of wood! See the CFT to lookup consumption emissions from wood products, a 90% efficient biomass boiler will generate 1.1-1.8 MWh of heat energy per cubic meter of logs, depending on wood type and quality.

      The point they seem to miss is; sequestering CO2 over ~150 years cannot be compared to ~150 million years of sequistration to make fossil fuels. While it is possible, and essential, to sequester emissions from burning biomas through sustainable agriculture, the same is not possible for fossil fuels.

      To their credit, the following FAQ covers the IPCC’s statement on carbon neutrality of biomass. Unfortunately, it appears they either did not read or not understand this. The key point in Q2-10 of the IPCC reference they quote is that emissions from biomass burning should be calculated as part of land use emissions rather than emissions from burning the biofuel. A sustainably managed biomass crop (say 10 year rotation or more) would have a net-zero impact. The consumption carbon emissions in the CFT (used in the example above) covers processing and transport emissions as published by the UK government.

      If you are interested, we cover this question as part of the Carbon Cutting and Carbon Lite training sessions.

    3. TheDevon County Council have published a revised landscape policy document for renewables. A number of district councils and Community Energy groups, provided input to this. It is not clear to what extent this input was taken on board, for example the CPRE’s ‘tranquil’ and ‘dark skys’ map from 2006 and 2016 are still being used as criteria for effective exclusion.

      The RTPI’s guidance in relation to local energy infrastructure planning was recently published. This provides further spatial planning guidence to councils.

      Teignbridge District Council is consulting on the major modifications made by the examiner of the local plan 2020-40. Consultation ends 1st Oct 2025. Let me know if you have any comments you’d like to make with respect to renewables and ghg emission targets.

      These policies and the local plan are likely to be impacted by the publication of the government’s onshore wind strategy.

    4. A recording of he Plymouth Uni training I mentioned at our last meeting can be found here. I have a meeting scheduled for the 3rd August  to discuss how best to communicate Climate Change in terms of its causes, concepts and effective actions. We’ll be comparing notes on our respective training programs.

      Some of ACT’s Carbon Cutters are planning to train as Climate Ambassadors under the Dept. for Education’s STEM Learning programme. Let me know if you are interested.

    5. Many in the industry are still unaware or unwilling to admit that electricity grid Carbon Intensity (CI) is not always linked to Time of Day (ToD) tariffs. As we discussed previously (notes from 10.04.25 meeting). Our region has a particularly high CI during cheap off-peak rates. In a recent webinar hosted by Vest Energy, an energy trading and optimisation company, this question was raised in respect of their Community Battery proposition. Its was encouraging to hear back from 3 members of the panel acknowledging this point.

      I’d forgotten to mention the interesting visit to high-density pumped-hydro trial operated by Rhenergise and organised by Regen. One surprising target is the over 80% round trip efficiency at the grid expected from this system, get more information on this grid-scale storage system here.
  • Energy group meeting notes (03.07.2025)

    Energy group meeting notes (03.07.2025)

    The next regular meetings will be:

    Thus. 31.07.25 at 16:30 in-person looking at a site of interest.

    Then 28th August by zoom at 19:00

    Here is what we covered:

    1. Meeting, purpose, format and times
    2. Global energy use and latest Carbon Budget, where are we?
    3. Devon and Teignbridge Climate plans, are they delivering?
    4. EV popularity, is it waning and why?
    5. New EPC standard (RdSAP 10), are they useful?
    6. Cooperation and competition in humans, which edges it?
    7. Government rooftop PV drive and balcony PV systems.
    8. Recent webinar/training: understanding climate change and secondary suppliers.
    1. We discussed the purpose and style of the meetings. One possible reason given for the low participation was confusion around the different times meetings were held (alternatively 19:00 and 16:30). Other reasons were that the notes were sufficient for most people. Please let me know your thoughts on the matter and any suggestions to improve participation or if you think it’s ok as it is.
      We decided to give the in-person meetings a practical focus, so the next one will hopefully be to help a group member find his mystery zombie-load and demonstrate how they’ve gone about reducing their building’s energy consumption.

    2. The International Energy Agency Global Energy Review 2025 is worth a read. It reports some encouraging trends, but GHG emissions are still going up. This means we’re using up our Carbon Budget even faster, requiring a more dramatic reduction in emissions as seen by the featured chart.
      If you’d like to understand what this essential graphic means to the actions we have to take, why not register for one of our Carbon Cutter Lite sessions? Or come to a meeting and ask.

    3. You can read progress on the Devon Carbon Emergency plan here. For Teignbridge as a whole, TDC has been compiling its own Carbon Plan covering the same themes (areas to tackle). TDC officers have compiled a number of actions for them as well as district councillors and local councils in the district to undertake. ACT has worked with TDC to make the objectives meaningful and implementable. The draft plan will now go for formal approval by the council in the autumn. We very much hope the key actions/initiatives agreed will remain and be acted on. ACT is committed to help deliver these to achieve the necessary GHG reductions in the district.
      If anyone is interested in being involved in some of the proposed initiatives, please contact me.

    4. EVs have become more controversial in recent times. Like all new things, there is much misinformation and scepticism, the introduction of steam (from coal) powered trains is a good example from the past. While there are several impartial/balanced sources for information (e.g. TECs’ Electric Vehicles guide), there are probably more sources of mis/dubious information. It is however surprising to see this from a reputable source quoting an attitude survey by the AAA (American automobile association).
      Admittedly this is the US which we felt differed from the UK (49% of those considering a new car would get an ultra-low emissions vehicle according to this attitude survey, and this summary of statistics). US consumers appear not to be as aware of their contributions to climate change compared to Europeans. It’s all about the money and convenience, clearly they’ve not played the E=mC2 game!

    5. The methodology to measure a building’s energy performance (EPC) has been updated and it is better. You can find out about the details in this webinar recording, the first part is a good introduction explaining the impact on anyone selling/renting or considering home improvements. Anyone interested in learning more about how to make building more energy efficient can contact me, look at our energy webpage or consider attending a building physics course like the AECB’s.

    6. The question of how did China leapfrog the US with its cheaper and more efficient AI approach was raised by a member. This is generally attributed to a number of reasons, including the greater cooperation in open-sourced software. It’s also helped by the Chinese government’s significant investment in technology, especially AI and, ironically, the restrictions placed by the US forcing China to innovate even faster.
      A good discussion in which we agreed that healthy competition was necessary, but competition for the benefit of financial/personal (or national) gain over others alone was ultimately self-defeating. With so many challenges facing humankind, it is sad to see conflict and division are still elevated by some for personal gain.

    7. The government has published its Solar roadmap in which it encourages the deployment of PV, especially behind the meter. As well as the roadmap, the link references so called “balcony” PV systems and attitude surveys for the UK.
      A group member asked if these balcony PV systems were worth having. As always, the answer depends on the purpose. These systems are generally cheaper as there is no labour involved, but also smaller as space and orientation are more limited. So the cost per installed kWp or generated kWh/year are no better than the payback you get from a conventional rooftop system. Because the bundled inverter plugs into a 13A socket, the maximum power generated will be limited (~0.8 kWp). See TECs’ solar PV guide for more information on how to select a PV system that meets your objectives.

    8. Plymouth university are running general and targeted workshops on Net-Zero and climate change. The general (introductory course) covers the same scientific material on the cause and consequences as ACT’s Carbon Cutter and CC Lite sessions. It is less clear on the actions people/organisations can take although it does include a forward-looking “Carbon Handprint” approach to actions. I’m hoping to have a meeting to exchange views and explore collaboration.

      Energy System Catapult ran a webinar exploring secondary electricity supplier models. That is buying your electricity from more than one supplier. Typically, this is envisaged for specific usage such as an EV charger. This was another significant study on how financial benefits could be extracted from time-of-use (ToU) tariffs without mentioning the need to line up ToU tariffs with local/regional Carbon Intensity (CI) of the grid. Luckly this question was acknowledged right at the end of the Q&A session. Indeed, the same Living Labs team had previously published a study that shows the ‘herd mentality’ created by targeted ToU tariffs. This creates an even higher peak demand than the current evening peak, defeating the primary reason for such tariffs. More worryingly, it results in higher overall GHG emissions, the exact opposite of why such studies are being undertaken. It would make more sense to spend the same effort exploring how to link ToU tariffs to low-CI so this can be financially beneficial to suppliers and consumers.
      See item #2 from our 24th March 2025 meeting for details on how to use grid CI.

    Written by Fuad

    Energy group coordinator

    fuad@actionclimateteignbridge.org

  • Energy group meeting notes (05.06.2025)

    Energy group meeting notes (05.06.2025)

    Here is what we covered:

    1. Carbon footprinting tool for farmers
    2. Energy network digitalisation for net zero by 2030
    3. Who determines the future companies and politicians or citizens?
    4. Climate curriculum for schools

    It seems that most find it difficult to attend in-person meetings, so we’re likely to go back to an all zoom format with the occasional face to face.

    1. In previous meetings we’d discussed extending the CFT & Carbon Intensity Lookup tools to provide additional detail for Carbon Intensities (CI) of food items as well as sector-specific items. Unfortunately, there are only two of us doing this work so don’t get round to doing it. Luckily other organisations are starting to produce free accessible tools, we’ve previously discussed the AECB and RICS efforts in providing building material CIs.
      Farm Carbon Calculator is another good example. The tool is aimed at farming businesses so is quite comprehensive. They publish their methodology and CI sources/calculations. An initial examination suggests this is a useful calculator which ACT may want to reference.
    2. NESO has started to provide some useful data on both the electricity and gas networks. Carbon intensities of the electricity grid was discussed in several recent meetings with links to their portal. You can also register to receive a newsletter from NESO.
      They are currently developing a Digitalisation Plan, an important element of reaching electricity grid near-net by 2030 (that is 85-95% renewables/nuclear generation). ACT will not be responding direct to this consultation, relying instead on Regen and others to do this. However, if you’d like to be involved, please contact me.
    3. Opinion has been divided on who should act to effect major reductions in ghg emissions. If it is corporations and politicians, it seems odd that they sometimes seem desperate to win our custom or vote. Even to the extent where they feel the need to greenwash their products or set policies which are more to do with appeasement than leadership. An AI search of the internet suggests that “While consumers may not always feel they have ultimate power over corporations, their collective actions and feedback have a significant impact on the marketplace and can ultimately force businesses to adapt to changing consumer preferences and values”.
      A typical example in the banking sector is this policy pledge. Others go further and give customers advice on what they can do. There is myriad more examples in all sectors, not all are actually implemented, so it’s up to us as consumers to check corporate action before we buy, there are always alternatives.
      It may also feel like the media and social discourse is tilting away from doing our bit to secure a habitable planet for future generations. This is certainly not reflected in the numerous surveys on the subject. Maybe it is just the final kicks of a dying argument? If so, it would be better to put our efforts into helping the vast majority who are on board to act effectively.

    Written by Fuad

    Energy group coordinator

    fuad@actionclimateteignbridge.org

  • Energy group meeting notes (08.05.2025)

    Energy group meeting notes (08.05.2025)

    1. Leaking flat roofs, too cold and too hot.
    2. Centre for Sustainable Energy’s study of variable tariffs.
    3. Spain’s power outage.
    4. Wind and solar farms.

    Unless anyone would like to suggest another venue in Teignbridge, the next in-person meeting will be at the Taphouse in Newton Abbot.

    1. Flat roofs are notorious for leaking, but they can also be a problem to insulate. If you live under a flat roof with inadequate insulation, you are likely to lose heat in winter and overheat in summer. So what’s the solution?
      Unfortunately retrofitting insulation in a flat roof isn’t as easy as adding traditional loft insulation between and above ceiling joists in the loft space of pitched roofs (also referred to as a cold roof insulation because the loft space remains cold). Flat roofs typically do not have easily accessible space between ceiling and roofing material (often the finish is roofing felt). So to gain access, either the ceiling or the roof covering have to be removed to add insulation.
      If there is a leak and the felt or outer roofing material has to be repaired/replaced, this is an opportunity to add insulation. Ideally above the rafters or a combination of this and between rafters. Insulation above rafters is sometimes referred to as ‘cold roof’ insulation, but the term is misleading when applied to flat roofs. Here is a useful explanation.
      There are also better roofing materials than felt, but these tend to be more expensive and require skilled installation, something the UK building trade is not famed for!
      Drawing curtains to keep the sunshine out in summer and in winter to keep the warm air in helps a lot. Opening windows if there is a marked temperature difference between inside an outside temperatures, this can cool/warm the room as needed.
    2. The CSE provides very good research and advice to achieve its mission. The recent webinar was billed to cover “The transition to a smart, low-carbon future” and how it “is transforming how consumers interact with the energy system”. You can watch it here.
      Two ACT energy group members had attended. It was strange that the webinar did not mention carbon emissions at all, focusing instead on financial benefits from these tariffs. You can watch the study’s conclusions, which are not surprising given that these ‘smart’ tariffs are aimed at those who want/can engage in how/when they use their electricity.
      As we’ve discussed on several occasions in the past, including last month’s meeting, There is a big mismatch between low-carbon claims associated with low-tariffs. The question was raised and answered by the CSE team at the end of the webinar if you want to take a look. Let’s hope they check out the information we gave them in the Q&A and include this information in future.
    3. Several sources were quick to blame the major electricity grid outage in Spain, parts of France and Portugal on renewables. While it is true that most of Spain’s daytime generation at the time was renewables, this is not an unusual situation. It is not yet clear what triggered the cascading shutdown, related to frequency fluctuations which cause automatic shutdown of all generator types.  No doubt not enough contingency planning had been made to prevent major and multiple failures from taking down the whole electricity grid. Here is a good summary from a week ago.
    4. We discussed the recent news that the largest offshore wind farm developer is pulling out. This is the second large wind farm development to run into trouble because of escalating costs, in turn caused by the multiple international events in recent years. Read the company’s statement on this here and the broader picture here. The first of these is back on track, so presumably the government will either have to adjust the Contract for Difference (CfD) arrangements or find another developer.
      This led us onto discussing onshore wind and solar farms and the relative merits/problems with each. ACT has published its position on this as part of our submission to the Local Plan. In this we favour wind development over solar farms, mainly because of the significant land-efficiency of the former.

    Written by Fuad

    Energy group coordinator

    fuad@actionclimateteignbridge.org

  • Energy group meeting notes (10.04.2025)

    Energy group meeting notes (10.04.2025)

    Here is what we covered:

    1. How should we update our advice on Transport?
    2. Feedback from Fue Poverty consultation.
    3. TDC’s Carbon Reduction plans.
    4. How reputable sources for tools and data can be misused.

    Good venue and company, sorry to anyone who could not find it. I think we’ll try one more location to see if this format works. I’ve had one comment about 16:30 start, especially for those working, this is why we alternate start times. Currently it seems more people prefer a zoom format.

    1. We went through ACT’s current advice on transport as applied to local councils. This seems to still be very relevant and useful, at least from a town councillor’s point of view. If you have any suggestions/thoughts on this, please send them to me.
      ACT also provides advice on more specific actions via the Carbon Footprint Tracker, search for “transport” here.
    2. I attended a very useful online presentation/discussion organised by Regen re the fuel poverty consultation. The points we’d agreed at our last meeting were broadly accepted and echoed by others. Here is a summary, if you’d like the full conclusion on the topic, please contact me:
      introduce a progressive unit pricing and/or social structure.
      split between standing/unit pricing.
      Vulnerable customers don’t use much energy or benefit from flexible tariffs.
    3. TDC are looking to publish their district wide carbon reduction plan. Comprehensive advice is likely to be targeted at officers with some advice to district councillors and local (town/parish) councillors. Their direct advice to residents and businesses is being delivered via the Teignbridge Climate Hub.
    4. As competition for service and equipment providers increases, several providers are quoting ‘typical’ user benefits, financial and carbon related. These are often based on ‘evidence’ from published tools/calculators provided by reputable sources. Although the tools and evidence is sound, the assumptions made about what a typical use can achieve tend to be unrealistic. However good a tool may be, if you put rubbish in, you get rubbish out!

      Here are some good quality resources recently quoted to ‘sell’ a product/service.
      System Advisory Model, a renewables technical/financial modelling package
      Carbon Tracker, finance and climate change.
      ICE database for embodied carbon from Circular Ecology.
      NESO database for grid Carbon Intensities.

      The last of these has been an on-going discussion in our recent meetings, particularly in relation to the claim that low electricity night rates reflect a low Carbon Intensity (CI). The following charts represent daily CI in Half Hourly (HH) increments averaged for 2023 plus the annual average CI long-term forecast. What isn’t immediately clear is that the daily CI is in fact for the whole of the UK’s transmission network. This is not at all representative of the CI for the electricity received in the southwest (region-11) which tend to have a very different pattern and generally higher CI.
      We’ll be coming back to this as more people in Teignbridge are buying into these tariffs in the belief they are doing the right thing.
  • Energy group meeting notes (13.03.2025)

    Energy group meeting notes (13.03.2025)

    Here is what we covered:

    1- Next Energy related topic to lobby government, follow-on from last meeting.

    2- Grid Carbon Intensity trends.

    3- Carbon reduction plans.

    Sorry not everyone was able to join the zoom, technology is not always reliable!

    1. By coincidence, there is a government consultation on updating their 2021 Fuel Poverty Strategy, closing date 4th April. Let me know if you’d like to contribute to this quite lengthy consultation as there is a Regen webinar scheduled for the 25th March (tomorrow!).
      Although this is very much focused on supporting fuel-poor households Q8 asks “Are there any additional principles that you think should be considered for inclusion in the new strategy?”. I will be raising the following with Regen who are responding to the consultation.
      “Energy unit pricing should be progressive, encouraging lower consumption through energy saving and low-carbon self-generation. Unit price thresholds or taxation (e.g. VAT) could be set, lower for low consumption and higher for high consumption. This would also help those in fuel poverty who cannot take advantage of variable half-hourly tariffs, smart meters and smart appliances. Users with special needs or those of national significance would need additional support as is currently the case.”
      This is not a new idea, but one which the UK seems reluctant to adopt as a fair mechanism to encourage behaviour change to consume less energy, with appropriate ‘protection’. In fact, many tariff arrangements encourage the opposite, the more you consume the less you pay.
      We also agreed to outline this case more generally and see if it can be supported by our local MPs.
    2. Grid Carbon Intensity (CI) is a topic we covered in the past, most recently at our January meeting, see item 6 of that meeting’s notes. We noted that several of the CI apps that inform users of their ‘local’ grid CI are no longer supported. The independent ones still available are:
      GridCarbon (find in your app store)
      NESO’s Carbon Intensity Dashboard
      Neither provide real ‘local’ intensities, rather they indicate the likely intensity based on the national Transmission grid’s CI, the only reliable source of this data. This typically accounts for ~70% of total generation (large generators/interconnects) with the remainder coming from our local Distribution grids, there can be large variations at a local sub-station.
      We discussed the recent shift in CI during the overnight ‘low tariff’ periods promoted by most electricity suppliers. Specifically, that this was on the increase compared to the equivalent day-time period. We’ll investigate the published data for the past 1-2 years to establish if this is true and to what extent is this happening.
    3. It is good to see that other district councils are supporting their local town and parish councils with practical advice on mitigating climate change. The South Hams Guide to Net-Zero has some useful references and starts by encouraging the use of a Carbon Footprint tool, very much ACT’s advice from 2019 to local councils. We’ve not looked at the LGA’s tool, so cannot comment on how well it compares to ACT’s CFT.  
  • Energy group meeting notes (13.02.2025)

    Energy group meeting notes (13.02.2025)

    Here is what we covered:

    1. Our meeting purpose and format.
    2. Electrical item wows.
    3. Is government backtracking on climate policies?
    4. Does Heat pump efficiency change with level of insulation?
    5. post meeting: latest UK Annual Emissions report with ref to domestic heating.

    What an excellent meeting, free ranging discussion and free beer!

    1- We agreed this format is worth repeating, but we should also try to have these in-person meetings at someone’s home or place of work. Any offers for April?

    2- We delved into a 30W microwave and 300W heat pump consumption when idle (i.e. standby) conundrum. Was this real, a measuring device error and does it matter? It turns out that these are real and action is necessary. The 30W Microwave idle power would amount to ~260 kWh of wasted energy per year.

    Finding out what my electricity is used for is relatively easy using the My Electricity approach. What to do about it relatively easy too, provided you have all the user’s buy-in. The first step to cut out waste, this often needs behavioural change (e.g. turning the microwave off when not in use), that’s not easy for many of us. The second step is to make the device more energy efficient, a reasonable alternative to doing the first step, provided the payback is right. That means; the outlay to improve efficiency (in this case a replacement microwave) will be less than the cost of not doing it (in electricity bills) during the expected life of the item (5-10 years depending on manufacturer). See if you can work it out for this example?

    3- It looks like the government has prioritised economic grown over everything else, including tackling climate change. Having pledged to revive the UK’s GDP growth, it is not surprising that the government needs to take ever more drastic measures to counter national and international ‘economic headwinds’. We think this priority is compatible with tackling several of the other challenges we face, in particular the existential ones like climate and ecological breakdown.

    We discussed examples of this, starting with the drive to build more and the Future Homes Standard (see our analysis here). We also looked closely at how to ensure the current near Net-Zero target for the electricity network by 2030 remains a priority for government. How can energy pricing be set to achieve this and stimulate economic growth? What are the pros/cons of progressive energy pricing, the role of gas in setting pricing and energy taxation in general. Let me know if you’d like to contribute to this topic further.  

    4- The question of Heat Pump (HP) efficiency is one of these evergreen topics. What exactly affects a HP’s seasonal performance factor (SPF), that is the heat energy output divided by the electrical energy input. You can find ACT’s current definitive position on this in chapter 3 of the TECs HP Guide.

    We love a challenge! If you have any references to articles or studies that suggest the level of insulation in a building has no bearing on the efficiency of a HP, please let me know. So far those articles that we’ve looked at in the past couple of years have not provided sufficient evidence, but it may exist. The most recent ones submitted are:

    5- Following on from last meeting’s discussion of dangerous Particulate Matter (especially PM2.5) from biomass boilers, this DEFRA report states that levels of emissions from domestic combustion have been dropping.  In 2023 all domestic combustion now contribute 20% for PM2.5 and 10% for PM10 of total UK particulate emissions. Also note the Nitrogen Oxides (Nox) emissions, another very harmful pollutant.

    Written by Fuad

    Energy group coordinator

    fuad@actionclimateteignbridge.org

  • Energy group meeting notes (16.01.2025)

    Energy group meeting notes (16.01.2025)

    Here is what we covered:

    1- new case studies

    2- onshore wind

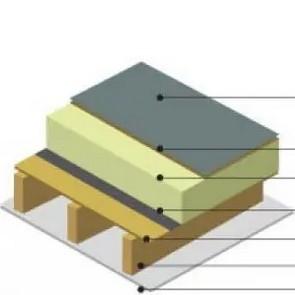
    3- combined PV/thermal solar

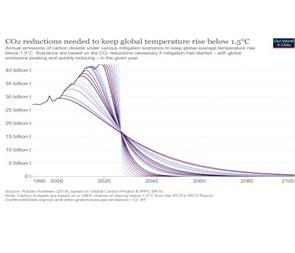
    4- articles on climate change

    5- DCC supply chain strategy

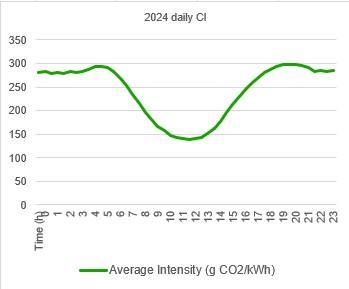
    6- 2024 grid carbon intensity

    7- electric construction equipment

    Hope you can make the more friendly setting of our next meeting, bring your topics of interest as there will be no set agenda.


    1- We’ve added 3 case studies to our list, if you’d like to contribute here are the guidelines.

    • Using ‘My Electricity’ for a community building (section 3.1)
    • Improving my Heat Pump (section 4.2)
    • Hydro power, really! (section 7.4)

    2- The government has an ambitious plan to double onshore wind generation from ~14 to 28 GW in the next 5 years. They have set up a Taskforce to drive this programme forward. One major obstacle is connecting this new capacity to the grid as NESO has just announced they have temporarily suspended new connection applications while they deal with the huge backlog.
    Regen has published a briefing paper on the misinformation about wind power here. For a straightforward guide to countering such misinformation, see their myth-busting guide written for the All-Party Parliamentary Group on Renewable & Sustainable Energy. 

    3- Combined PV/Th solar panels are not new, but have not been popular for a variety of reasons. In a domestic setting, where residents would typically want the full PV generation potential, the excess thermal generation would need to be curtailed during many months of the year. A simpler/cheaper option is a PV panel with diverter to the immersion element in the hot-water tank.
    A commercially application where large quantities of hot-water are needed, may be a suitable application for these combined solar panels. This example in London has some undefined claims such as “Most of the remaining 80% of the sun’s energy is converted to heat”. It is true that thermal systems can be more efficient in extracting the sun’s energy, but storing this can be problematic if not put to good use within a day or so. The cost of such systems can also be prohibitive depending on the application. These systems are only suitable for hot water during the summer months.

    4- Over the past few months we’ve considered good and bad news articles about climate change. The datacentres in Ireland was one example, here are a couple more that were sent in:

    Biomass boiler emissions are back in the news with this article from the Guardian. We covered the topic two years ago when it first broke. The referenced report only covered pre-2000 biomass boilers and wood burners.
    While there are serious problems with many wood burners and how people use these, it is not correct to suggest that modern biomass boilers are ‘damaging’. Specifically, excluding production emissions which can be high in some circumstances, burning properly seasoned wood is carbon neutral. Equally, burning inappropriate wood containing glues/paints/preservatives is very dangerous under any circumstances.
    The RHI scheme regulates emissions and requires participants to use certified biomass products. This includes:

    PM2.5 regulated emissions must be less than 30mg/MJ, much less than the over 50mg/MJ for oil boilers, the target replacement technology for off-gas-grid buildings where heat pumps are less appropriate.

    • Emissions are verified annually through boiler testing (independent MOT) and wood fuel sample testing in a lab.
    • Many, maybe half, of boilers achieve below 20 mg/MJ
    • Larger scale boilers (e.g. district heating) or smaller ones in populated areas, reduce this even further through appropriate filtration.

    Here is another article to debunk Direct Air Capture as a potential solution. Interesting to see they the example publication they reference.

    5- It’s good to see DCC has a Low Carbon Supply Chain Strategy, could this be an example for our district council to follow?

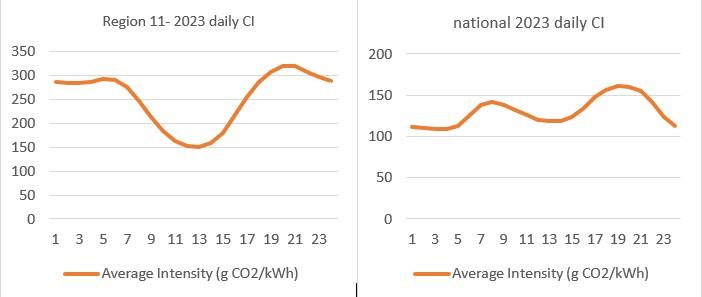
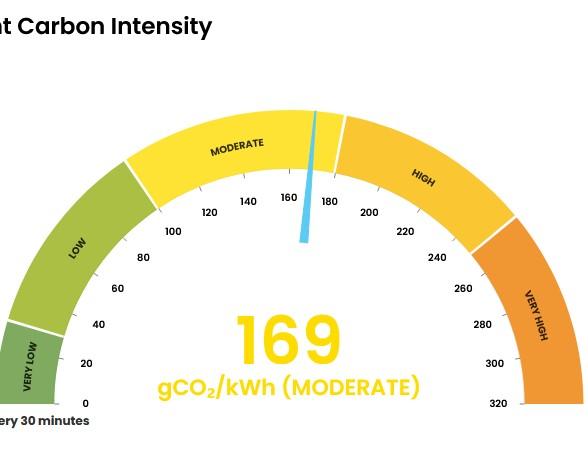
    6- The Carbon Intensity of the electricity grid (CI) changes year on year. It is measure in Kg CO2e/kWh consumed. It applies regardless of who you buy your electricity from or what claims are made about how ‘green’ this is or what time you use it, see our Greenwash guide. A BBC UK electricity grid CI for 2024 article (go to 7th Jan report) suggests this has droped significantly to 0.124 Kg CO2/kWh. On the face of it, even below the 0.150 Kg CO2e/kWh used by current building regulations to assess ghg emissions from buildings.

    A closer look at the text reveals this is for “generated electricity”, so ignoring losses which account for ~10%. A further ~20% needs to be added to convert CO2 to CO2e. Then there are the ~25% additional scope-3 emissions generated outside UK boarders. The resulting 0.205 kg CO2e/kWh is still an impressive drop from the 0.275 kg CO2e/kWh actual CI last reported by government in 2022. These are provisional numbers, you’ll see the actual ones reflected in ACT’s CFT when they are released.

    7- Electric construction equipment has come a long way since we looked at these several years ago. At the time we did not think that battery technology would be sufficiently practical or cost effective. Clearly other criteria like noise play an important part.

    Written by Fuad

    Energy group coordinator

    fuad@actionclimateteignbridge.org

  • Energy group meeting notes (21.11.24)

    Energy group meeting notes (21.11.24)

    The next regular meetings will be (no December meeting):

    Thus. 16.01.25 at 19:30 and every 8 weeks
    Thus. 13.02.25 at 16:30 and every 8 weeks. This will be a face-face, probably in a public place that serves food/drinks (details to follow)

    Here is what we covered:

    We had a wide-ranging discussion on who’s emitting most carbon and does it matter. This came up from a very recent report sent in by a group member which asserted that:

    • The richest 10% in the world were responsible for 50% of ghg emissions
    • The richest 1% in the world were responsible for 16% of ghg emissions

    There are many such reports that indicate a direct correlation between income and level of emissions. These numbers have been widely quoted from an original report based on 2015 data, see also this portal. Our World in Data has similar statistics based on wealth of countries rather than individuals.  The personal experience of energy group members, in some cases based on real assessments carried out in Teignbridge, bears this out.

    Whether these numbers are accurate or even relevant is not what we should be focusing on. Doing this can lead to finger pointing and alienating the very group we need to bring on board. Nevertheless, focusing our efforts on those in Teignbridge with a higher socio-economic level would be more effective in mitigating climate change.

    With this knowledge we should also be able to tailor our message and initiatives to be more effective. For example, highlighting that a small reduction of a large number represents a significant amount of emissions and cost. Finding ways to do this through simple changes in our behaviour is an excellent self-motivator.

    This is the approach of the My Electricity initiative and associated tool. Although not specifically aimed at the top income bracket, it is likely to be most effective for households/businesses on incomes/turnover greater than £30,000. The higher the income/turnover, the greater the potential saving.

    Also worth supporting (i.e. lobbying our representatives) are large-scale mitigation actions that change behaviour and lead to positive tipping points in climate mitigation. Initiatives such as frequent flyer, TEQs, Carbon-Currency and a progressive energy pricing model driven by Carbon Intensity and levels of consumption, would be powerful tools to ‘nudge’ behaviour change. These do need to be backed by regional/national/international policies, so require explanation to keep the public onboard.

    We also covered geo-engineering measures and carbon sequestration. The recent Panorama program “can science save the world” gives the impression that we can carry on as before if we embraced more technology. While it’s true that we will need large-scale technological changes to be more efficient in our energy use and to capture CO2 already in the atmosphere (sequestration), these alone cannot avoid the imminent 1.5oC tipping point. We need to quickly reduce (by half) or emissions. Even natural sequestration, with all its ecological benefits when done well, cannot deliver the necessary reductions CO2 levels in the time available. Here is just one of many reports which explain why this is not feasible, even by one of the more efficient natural sequestration solutions. The bottom line being; we have to get away from wishful thinking that offsetting, natural or technological, is a silver bullet. The essential first step will have to be a wholesale behaviour change of halving our consumption and doing it quickly. Not doing so will result in the technology silver bullet taking us out!

    We didn’t manage all agenda items, but we did briefly cover a couple of new guides in relation to energy/emissions building assessment tools. Different modelling tools for building energy/emissions assessments we’ve previously covered include (see our webpage and previous meeting notes or just ask):

    While we wait for secure cycle parking for the bus connection at Drum Bridges near Heathfield, we can temporarily use a new covered cycle lockup outside the newly refurbished Stover Park (with CCTV but at your own risk). Visit Stover Park anyway as it has some great indoor/outdoor spaces on offer.

    Have a good festive season and hope to see you in the new year.

    Written by Fuad

    Energy group coordinator

    fuad@actionclimateteignbridge.org