The next regular zoom meeting will be on Thursday 6th July 2023 at 16:30 – 18:00 (and every 4 weeks thereafter).
We started by discussing one of the attendee’s experience with their Heat Pump. Much of the energy consumption before and after conversion from mains gas was recorded. This represents an important dataset for a case study which we can add to the collection already available, more on this at our next meeting.
We spent some time discussing options on how to reduce the impact of public Christmas lights, in this case LEDs on lamp posts. The estimated energy consumption would be about 25W for 7 hr per day on 10 lampposts (~0.2 kWh each per day). After agreeing that bicycle power or converting the methane from a cow at each lamppost may be a good way of engaging the public, their practicality would present some challenges! Not least, which end to collect the methane from. In the end we decided that either electricity from the grid would probably be the lowest Carbon option (~0.26 kgCO2/kWh). To recover the emissions from making the batteries and solar panels would take some time, unless these were regularly used for other events. We didn’t do pay-back calculation for an expected product life of 10 years, so do send me yours to see how easy you found it to do the calculation.
The role of forests and other natural carbon sequestration options often comes up. This article provides some useful insights into the subject. The data seems plausible given other references to the subject. There is just one major concern in relation to the baseline number used for current CO2 emissions from using fossil fuels and cement (≈ 9.4 ± 0.5 GtC/year). Can anyone explain this given that most ‘reputable’ sources put that number at ~34 GtCO2/year just from burning fossil fuels?
Several of you sent in the Rowan Atkinson piece on EVs in the Guardian newspaper. Much of this, but not all, reflects ACT’s position on the matter as reflected by the references to EVs on our website. Specifically, that we should not just buy a new EV, instead we should consider (calculate) the full life-cycle greenhouse gas emissions of this and other options appropriate to our specific circumstances. I’ve previously mentioned the rule-of-thumb; if you do less than 5,000 mi/p.a. you are likely to increase your overall emissions, within the expected life of the vehicle, if you replaced your old ICE with an EV. If you do more than 10,000 mi/p.a. you are likely to reduce your overall emissions.
We didn’t have a chance to discuss Simon Evans’ response ‘debunking’ all the points made in the initial piece. Maybe we should pick some of these up at our next meeting, in particular the various references to ‘evidence’ why Rowan is wrong, e.g. the government’s cost-benefit analysis and the source of the life-cycle emissions analysis. Note the disclaimer in the latter “We emphasise that the forward-looking projections, forecasts, or estimates are based upon interpretations or assessments of available information at the time of writing”. Also to note is that both Guardian articles are using general assumptions on vehicle usage and owner behaviour, these do not apply to everyone.
There are some useful webinars being hosted as part of the Community Energy fortnight, please check availability as these are happening now.
We also briefly covered:
Some of the possible volatility in the electricity supply and how this might play out in the UK.
Teignbridge District Council’s draft Local Planis open for comment until noon on Monday March 13th. The plan details ‘how’ and ‘where’ proposed new housing and employment related development will take place in the district until 2040. It includes site allocations for housing, employment and wind turbines. The sites included are additional to those already allocated under the existing Local Plan.
This is the final version of the plan after several previous consultations. After the consultation closes there will be a public examination hearing held by an independent planning inspector.
If you wish to respond to the consultation it is advisable to watch the explanatory video. To read the whole plan, click on the Proposed Submission. For a shorter read, go to the Need To Know Guide. Note that when you are ready to respond, you have to scroll down to the bottom of the page to find the Start button.
You can comment on specific aspects of the plan, the whole plan, other consultation documents or supporting evidence. There are sections on climate change and the environment that lay out the proposed policies on these issues.
In brief
The plan allows for 4,560 new homes.
This is additional to the 7,969 already committed toin the existing Local Plan.
About 65 hectares are allocated for employment sites.
There are 10 sites for wind turbine development, which the plan says could generate 15% of the district’s electricity supply.
Quite a lot of land has been identified as potentially suitable for installing ground-mounted solar photovoltaic panels.
Most of the homes will be built in or around Newton Abbot and Kingsteignton (37%) or on the edge of Exeter (46%).
Of the new employment sites 55% are allocated to Newton Abbot and 31% to Exeter.
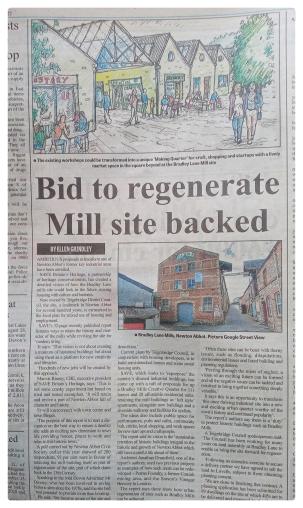
Friday 8th October saw the public release of the planning application for Bradley Lane in Newton Abbot (22/01500/MAJ), writes ACT Wildlife Warden Eloise Rokirilov. Long pending, starting at 171 documents and growing, the expiry date for comments remains at 4th November. The application calls for wholesale demolition of all the buildings, the burial and diversion of the medieval leat, and the construction of 90 new residential properties.
Why is Bradley Lane of interest or importance to anybody?
Of environmental as well as historic and archaeological importance, Bradley Lane is a brownfield site containing a set of attractive mill buildings, and a medieval leat that runs through the valley and into the town, joining the River Lemon underground near the Jolly Farmer. Mills have been sited on or around the area since the 13th century. They were originally built to serve Bradley Manor, the nearby Grade I listed National Trust property.
The buildings are a testament to the wealth and contribution of the Vicary family, who were key to the industrial prosperity of Newton Abbot. Employing around 700 people at its peak in the 1800’s, the family’s substantial business interests included wool milling, fellmongery (stripping wool from sheepskins) and tanneries. With the increasing use of synthetic rather than natural materials, among other things, the business finally closed in 1972. Bradley Lane cottages were, of course, workers cottages in their time, and there is a WW2 bunker between the mills and the old Benbows buildings.
Suffering repeat destruction from fire and flood over the centuries, the mills were proudly rebuilt on each occasion. The current buildings display a family plaque, “JV & S Rebuilt 1883”, celebrating its reconstruction in this year before its penultimate catastrophe, there also being a fire in 1921.
The mill buildings are far from the end of their life, being built of red brick, Devon limestone and local clay brick, some of the strongest material around. Historic England and the government themselves have started shouting more loudly about the need to avoid demolition, and instead retrofit and convert buildings as a way of meeting net zero. In a climate and ecological crisis, this makes sense. Demolition releases substantial carbon and other particles into the atmosphere.
Purchased by Teignbridge District Council in 2010, the mills continued to be used for commercial purposes. The council profess a long term intention to develop the site, and is proud of championing social housing on a brownfield site. Councillors state the intention is for the proposed development to include 44% affordable housing. However, the Viability Assessment report indicates a flat refusal by the developer to provide affordable housing as it is not financially viable. Instead, the intention is to sell 18 of the 90 units (20%) to the Guinness Trust, which will provide social rent housing. Homes England have offered funding of £2,063,400.
More crucially for the environment, the Waste Audit Statement shows striking, estimated figures:
14,000 tonnes of concrete, brick and stone to be demolished, and recycled on site.
240 tonnes of asbestos to be removed and transported to landfill.
5 tonnes of greenery to be cut down and recycled off site.
450 tonnes of tarmac to be recycled on site.
The present site has young trees on the west side by the River Lemon, and semi mature trees at the base of Hunterswell Road, where the recent bus survey proposed to put a bus lane, but according to this application, will instead have one self build plot on it.
The Ecological Mitigation report shows thorough work on bat surveys, although it does not mention the leat, which is known to contain European eels, a protected species. However, it has general ‘mitigation’ measures for amphibians and reptiles. There are more details in the 2019 survey report showing that the site is within the South Hams SAC for Greater Horseshoe bats, and located within a Devon Great Crested Newt consultation zone. Also that otters had been recorded within 1km of the survey area. Mitigation will involve staged cutting, in order to allow nature to escape.
Arsenic is recorded at 15 times the acceptable level and “the results of the risk assessment have shown that the concentration of arsenic within the upper made ground and lower natural soils poses a potentially significant risk of causing harm to end users of the environment”. The document nonetheless maintains that there are no concerns of contamination, danger or pollution to people or the water course.
Newton Abbot & District Civic Society applied to Historic England for listing for the buildings, as well as to TDC’s own Community Asset Register, which would also allow a Community Right to Bid should the owner decide to sell. The latter issued a flat rejection stating, “the buildings do not fulfil the requirements of the Localism Act 2011″. They also failed to meet the listing criteria for Historic England. They were noted for their strong local importance, but did not meet enough national criteria and had suffered too many changes over time. TDC did not respond to requests for internal viewings of the buildings, so any internal features could not be noted in the application.
Having evicted their last commercial tenant in March this year, TDC is presumably paying each month for the buildings, which could explain the determination to succeed with the current planning application, in an effort to recoup finance and resolve the future of the site. Of the evicted commercial tenants, at least two returned to Torquay, losing business for Newton Abbot. Benbow Interiors moved to the Brunel estate in 2019 in a deal that saw a new, funded site being built for them.
NADCS had already engaged a national charity, Save Britain’s Heritage, who took the time to visit Newton Abbot with an architect in tow, and were inspired to produce a 32 page report with architectural illustrations showing an entirely different vision for the site. They advised it is possible to accommodate 111 homes by way of conversion and some new build, including 28 affordable homes, which is more than the present application. The architect has worked on some major post-industrial sites including Heartlands in Cornwall and Sarsons Vinegar Factory in London. There are many examples around the country of successful conversions, including Digbeth in Birmingham and Finzels Reach in Bristol to name two more.
We are in a time of mass development, and a common theme of lack of affordability. Cranbrook in Exeter is currently in the news with another 1,000 houses proposed on 220 hectares of former farmland. The question has to be asked, where does it end?
With a deadline of 4th November, we would urge readers to comment on the planning application, and support conversion instead of demolition.(www.teignbridge.gov.uk/planning and search reference 22/01500/MAJ).
On Tuesday 13th September I attended a webinar to introduce Power Allotments Devon along with colleagues from TECs.
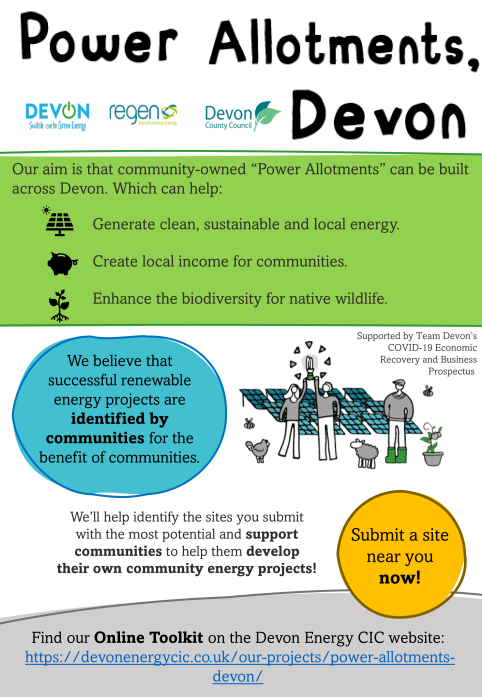
This Devon wide project hopes to encourage local communities to build, own and benefit from their own renewable energy power station projects across Devon, creating spaces for biodiversity net gain and generating an income for local people.
To find out more you can visit the Power Allotments Devon website, here you will find a toolkit which includes a handbook, interactive map, and submission form which enables you to identify and submit possible sites.
This post considers the proposition that most energy could be generated from renewables near to where it is needed. This article starts with a brief history of the electricity network, which reminds us that its origins were local in nature, and of how the grid evolved.
History of the electricity network
In 1881 the town of Godalming in Surrey established the first public electricity supply driven by a water wheel. This supplied street lighting and electricity to those that wanted it. In that year street lighting went out to tender and the cost of lighting by electricity was 19% cheaper than by gas.
In the late 19th Century a battled raged over whether we should be using alternating current(AC) or direct current (DC) for electricity distribution.
By 1900 many town councils were building power stations, which were typically fuelled by coal brought in by train. Over time these council power stations would be connected together to give greater flexibility, first using 2.2kV. Over the next 20 years a network at voltages 6.6, 11, 33 and 66kV developed. By the 1920s the network increased to 132kV. This meant that council generators could be replaced by larger regional stations.
In 1926 the Electricity Supply Act introduced effective national energy coordination. The Central Electricity Board was formed to concentrate the generation of electricity in a limited number of stations, which were inter-connected by a national grid by 1935.
Newton Abbot power station, built at Jetty Marsh in 1898, played its part in this development. It was bought by Torquay corporation in 1920, converted to AC, and used to provide power out to the coast. Newton Abbot power station developed to have a peak capacity of 52MW in 1948.
Newton Abbot Power Station 1949
In 1948 electricity supply was nationalised and eventually Newton Abbot power station was connected to the National Grid.
By the 1960s higher voltages (275kV and 400kV) started to overlay the grid with a supergrid. Nuclear stations started to appear placed near to the sea for cooling. Instead of transporting coal down to the south to generate electricity, electricity was generated by the coal fields and transmitted down south.
The Problem
Historically the transmission network developed because generation from coal was better placed near to mines than close to demand, because:
It was cheaper to transport electricity than to ship coal to cities.
Burning coal had caused caused serious atmospheric pollution including a smog that turned many building black.
The current development path for electricity generation and the electricity network involves placing a large amount of off-shore wind generation in remote locations, National Grid is planning to spend £54 billion to upgrade the transmission network to accommodate 50GW of off-shore wind energy.
Onshore wind and solar PV near to demand remain under exploited.
The alternative of much more local generation from solar and onshore wind backed by storage does not seem to have been seriously considered by government.
It appears that the network has evolved by patching up what already exists, each patch adding on expense and complication.
The network exists to supply electricity demand. So we need to ask if demand can be satisfied without so many expensive additions to the periphery of the network.
In an electricity network demand at any point in the network must be matched instantaneously by supply, if this does not occur the voltage and frequency will drop, which will cause issues for connected devices such as flickering lights. When a load switches on this increases demand on the electricity supply, which must either supply that demand from storage or generation. Currently all this supply to demand generation is handled centrally.
Now there is significant small scale generation connected at LV substations, this is currently seen as a problem to the network because it behaves in an unplanned manner. It should be seen as an opportunity to efficiently supply local demand. To do that at a local level there needs to be:
Storage so that:
over a day cycle at least supply and demand can be matched.
surges in demand are matched locally.
Smart systems so that:
Larger discretionary load (EVs, some heat pumps, water heating, appliances) run times can be timed to make best use of supply. Different user’s demands could be coordinated to avoid overloading the system.
Local supply and demand can be predicted, so that any additional supply from elsewhere in the network can be acquired in the most advantageous way (price, carbon intensity, availability of renewables could be considered).
Smart system would exist both on sites and at LV substations.
If there were sufficient solar and storage, such a scheme could work well in the summer (based on scaling up domestic experience). It would need onshore wind to continue operation through the winter, this may not be on the local LV network, but would probably be fairly close, so would need to be linked into systems at nearby LV substations as a preferred source of supply.
Only when there wasn’t enough local generation would it be necessary to procure electricity on the wider grid.
This may have significant costs at each substation, but bear in mind that there are 230,000 ground mounted substations in GB, and that National Grid intends to spend £54bn on upgrading the transmission network. This is equivalent to £234,000 per substation.
It is at least theoretically possible to meet the UK’s electricity demand using:
Renewable generation – mainly wind and solar, but also other technologies as these develop.
Storage of various durations including batteries, pumped hydro.
A relatively small amount of dispatchable generation (green hydrogen, biofuel generation, etc.)
This has been demonstrated by CAT and REGEN studies.
Consequences of carrying on as we are
Cost of upgrading the transmission network for 50Gw of offshore wind
According to carbon brief National Grid ESO plans to spend £54bn upgrading the transmission network to be capable of carrying 50Gw of offshore wind planned for 2030. When the wind blows it seems plausible that SW demand could be met by off-shore wind from the north sea. This is equivalent to £234k per ground mounted LV substation (assuming 230k ground mounted LV substations). Also £2k per property
Most of the electricity consumed in the South West is not generated in the South West
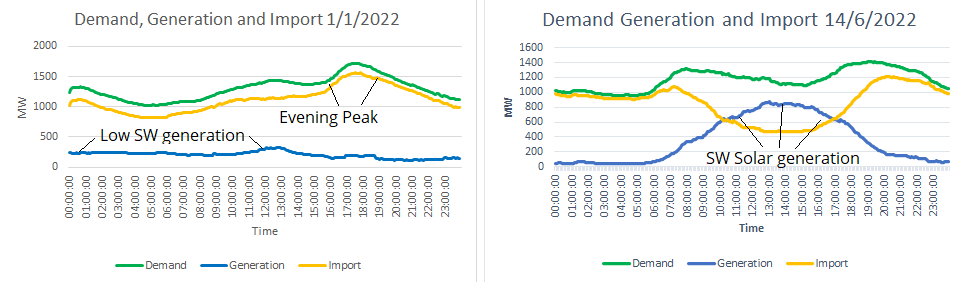
Most of the time the majority of electricity demand is met by generation outside the South West.
Normally electricity demand peaks between 4pm and 7pm and is at its lowest overnight, and most of the time local generation is much less than demand. On sunny days PV generation is significant, but still not enough to meet demand.
It is expected that by 2030 electricity demand will have increased substantially due to electric vehicles and electric heating.
Does Grid demand need to increase
Conventional thinking says that electricity demand will double because of electrification of transport and heat.
This would not be the case if:
The standard of insulation of all buildings were improved substantially
Private vehicle use were to be reduced, in favour of active transport and public transport.
Lightweight electric vehicles such as e-bike, e-scooters were to be used more.
Enabling Technologies
Renewable energy is the cheapest energy source
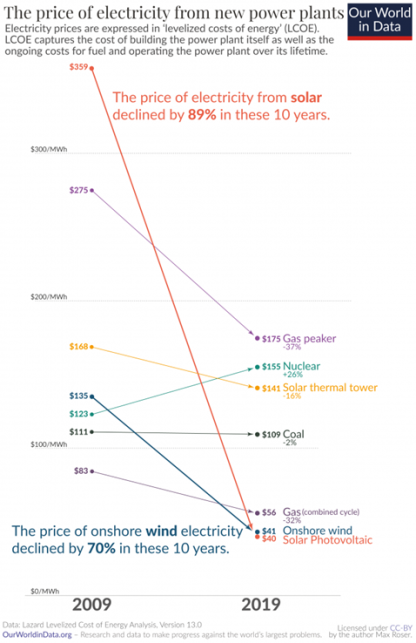
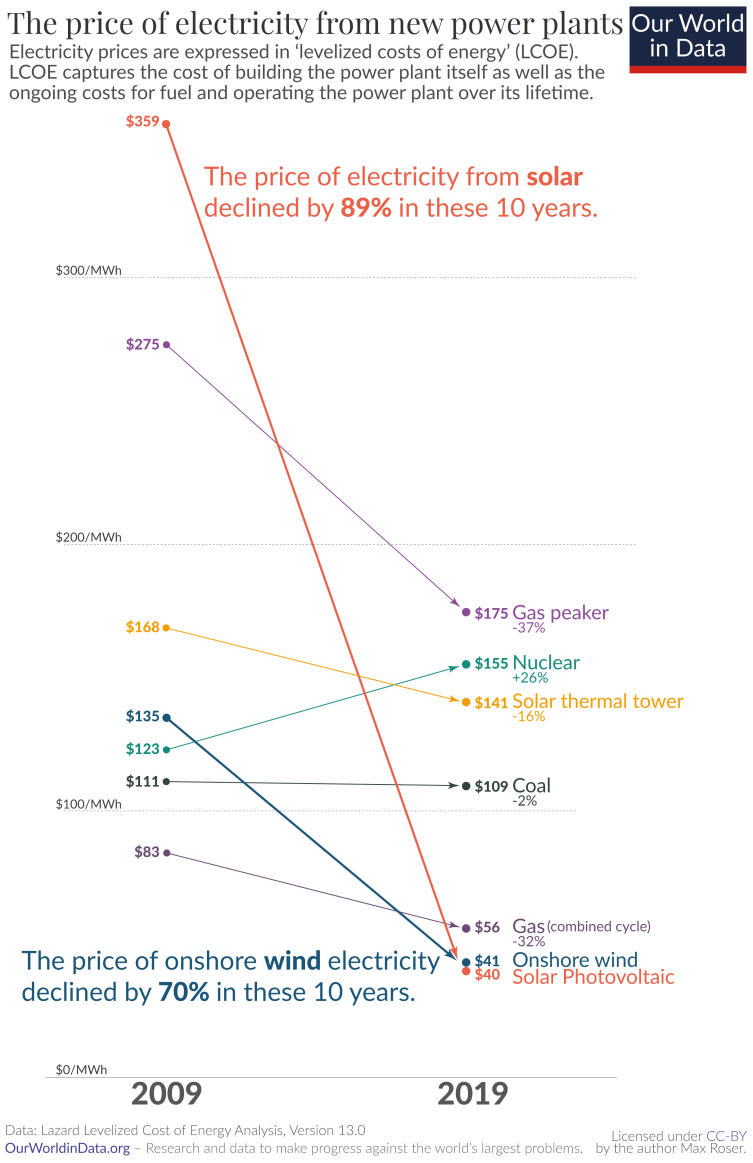
Why did renewables become so cheap so fast? from Our World in Data studies the fall in the cost of wind and solar between 2009 and 2019, and suggests possible causes. They found that the cost of electricity generation from solar dropped by 89%, and on-shore wind by 70%. A similar thing has happened with off-shore wind, but not with nuclear.
This rapid cost reduction for renewables has resulted in electricity from gas costing roughly 4 times as much a from renewables, following recent gas price rises.
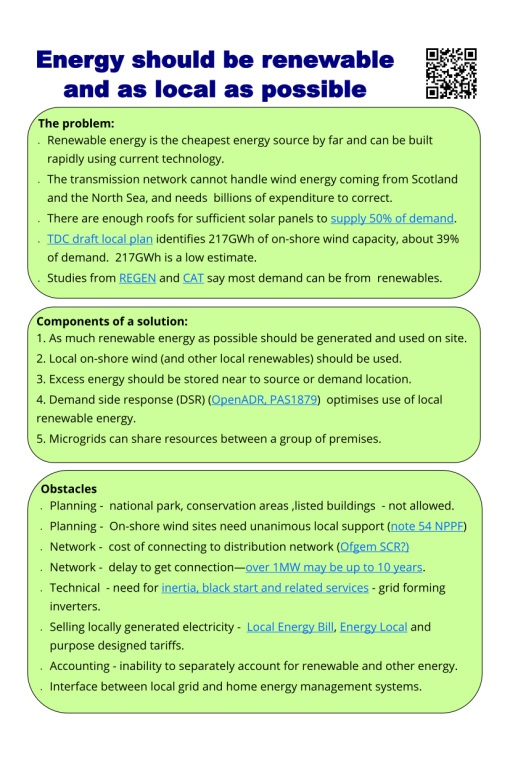
50% of electricity demand could be met by solar PV on commercial roofs
According to Solar PV on commercial buildings, a 2016 report from BRE: “There is an estimated 250,000 hectares of south facing commercial roof space in the UK. If utilised this could provide approximately 50% of the UK’s electricity demand.”
In practice 50% is probably an over estimate because this much solar is unlikely to be timed to match demand, however, it should when combined with storage to make most buildings self sufficient for the summer.
Teignbridge has many existing buildings without solar, though recent applications for new commercial buildings have often incorporated substantially more solar photovoltaics than is required by the building regulations.
A case in point is the recent application by Lidl to build a store in Bovey Tracey. According to the carbon reduction plan submitted as part of the application, the roof will have 180kWp of solar panels, which reduces the building’s regulated emissions from 111tonnes of CO2 equivalent to just 4 tonnes. We can expect other examples to come forward following energy price rises.
With sufficient panels and storage it should be possible on many sites to be almost self-sufficient between March and September.
Teignbridge’s draft local plan identifies 217GWh of on-shore wind capacity
Teignbridge’s draft local plan identifies 217GWh of on-shore wind capacity, which is about 39% of current demand. We think that 217GWh is a low estimate.
Public Opinion on Renewables
A recent opinion poll by survation shows that there is overwhelming public support for building new wind and solar farms to tackle the cost of energy crisis.
Another poll also from survation shows that both the public and conservative voters believe windfall tax on energy producers should form a part of paying for energy bill cap.
STORAGE
Another essential component of a locally based solution is sufficient storage. This would be used for:
Storing solar energy during the day to use at night, this would often be for use on domestic or commercial sites where it had been collected.
Storing of local wind energy when it abundant for later use, it is possible that when local wind is abundant it would also be relatively cheap.
Network management purposes, such as short term balancing.
Longer term storage to survive longer shortages.
DNO operating licence prevents them from owning storage, so grid connected storage at substations would require another operator.
LV substations
Most sites connect to an LV electricity station, which then connects to the distribution network. The capacity of a substation and the distribution network it connects to is limited, if demand and local generation can be managed to within this limit then there will be no need to upgrade the substation or distribution network.
Accurately managing power at a substation level requires substation metering and intelligence at the substation, this would be relatively low cost, but most substations currently have very little monitoring.
Larger demands could be accommodated when there they are matched by local generation. Storage either at substations or behind the meter also helps maintain the balance, both by storing excess local generation, and charging during periods of low demand and excess external generation.
Demand Management
Demand from things like EV charging, heating water, running storage heaters (and heat pumps in suitable houses), as well as appliances such as washing machines and dishwashers can be shifted provided that demand is satisfied within some time window. If you have solar PV and you choose to do the washing when the PV is exporting, this is a kind of demand management.
This concept can be extended to networked grid connected devices, which can register that they require an amount of energy by a certain time, the grid then works out when it is going to supply the energy.
OPENADR
The OpenADR Alliance was created to standardize, automate, and simplify Demand Response (DR) and Distributed Energy Resources (DER) to enable utilities and aggregators to cost-effectively manage growing energy demand & decentralized energy production, and customers to control their energy future. OpenADR is an open, highly secure, and two-way information exchange model and Smart Grid standard. Together we are creating the future of smart grid modernization today.
OpenADR – Article on BSi adoption of OpenADR 2.0BSi have published two standards based on OpenADR:
PAS 1878:2021 Energy smart appliances. System functionality and architecture – Specification
PAS 1879:2021 Energy smart appliances. Demand side response operation – Code of practice
Microgrids
It may not always be possible for individual premises to have the most advantageous combination of on-site renewables and storage. There could be economies in installing a wind turbine, sharing rooftop solar between several premises in the same building, or sharing a large ground mounted solar setup. As soon as the grid is used to connect to a larger resource, grid charges are involved.
A microgrid consists of several sites which are connected together, share common resources and a single (probably smaller) grid connection.
Most of the time electricity comes from on-site resources.
When on-site resources are insufficient, or it is otherwise advantageous to do so, the microgrid will draw on the grid, and either distribute electricity to members, or store it for later use.
A microgrid could be a group of dwellings or a business park.
Microgrids are only really feasible when building from scratch, new estates or new developments, where renewable energy and storage can be shared. There are significant operational issues beyond construction.
A virtual microgrid could exist at an LV substation, if a number of connected sites were to aggregate their supplies. This means the operation and maintenence remains with the DNO, but a community can share resources such as renewables or storage.
What about Inertia, Black start, Power factor correction and so on
It is sometimes claimed that a grid consisting entirely of renewables will be unstable, and unable to start if it is ever shut down. You will often hear terms like inertia and black start used in this context.
Conventional generator have a spinning turbine, which tends to carry on spinning at the same rate when power is removed because of Inertia. Whereas solar PV and wind turbines use inverters to generate alternating current (AC) to put into the grid. Normally inverters are grid tied, which mean that they depend on the presence of AC to produce alternating current. Grid-forming inverters on the other hand will produce AC based on a local signal source.
This article gives a good description with video of Inertia and related concepts, and describes how a grid powered entirely by renewables can work with Grid-Forming inverters. New large renewable generators connecting in Texas have been required to do this for some time.
ZERO CARBON BRITAIN (ZCB)
ZCB is a study from Centre for Alternative Technology, which amongst other things models how the UK could be powered by renewables, including 84% of the time with wind and/or solar. They based this study on 10 years of weather data at half hour resolution.
Firstly there is a lot of scope still for generation on sites where electricity is required, which would avoid any change in grid capacity. This could lead to many sites being self-sufficient for a significant part of the time.
A typical site would need:
Renewable generation in the form of rooftop solar, and for larger sites smaller wind turbines
Storage sufficient to ensure 24 hour power on good generation days, possibly longer.
Energy management system to handle scheduling of larger loads (EV charging, Heat Pumps, Water Heating, Appliances)
LV Substation
Key to all this is a smart local network, which would have:
Sufficient storage to deal with demand fluctuations and to store electricity procured from outside advantageously (either in terms of price, carbon intensity or renewable availability)
Smart system which monitored system performance, and negotiated supply of larger loads with connected sites.
The LV substation would be able to fairly accurately predict the load that would be placed on the higher voltage network, and would be able to draw down supply when it was available. This would lead to a much more stable situation for the higher voltage network, which could then dispense with many of the patches that it currently has.
It may also mean that much less reinforcement would be needed to the higher voltage network.
Obstacles
Policy
Ofgem currently has a policy of being technology neutral, prioritising what it sees as the best value, regardless of climate concerns.
Government is generally technology agnostic, rather than prioritising renewables.
Planning
Designated areas more difficult for renewables
Commercial scale renewables such as wind and solar farms are not allowed in National Parks.
In the National Park, conservation areas and on listed buildings renewable technologies generally require planning permission. Planning permission is determined by the aesthetic effect that the renewable installation has on the area. This means that it is unlikely that permission would be granted for:
Standard monocrystalline silicon panels facing a road
Horizontal axis wind turbines
Permission is more likely if the renewable installation is out of public view, or is designed to fit in with the street scene. This could be by using things like solar slates.
If you live in Dartmoor National Park (DNPA) and want to fit renewable technologies to your property, then you should seek planning advice from the park planners.
National Planning Policy Framework (NPPF)
The following is a copy of the paragraphs that have effectively stopped planning applications for onshore wind.
When determining planning applications for renewable and low carbon development, local planning authorities should: a) not require applicants to demonstrate the overall need for renewable or low carbon energy, and recognise that even small-scale projects provide a valuable contribution to cutting greenhouse gas emissions; and b) approve the application if its impacts are (or can be made) acceptable54. Once suitable areas for renewable and low carbon energy have been identified in plans, local planning authorities should expect subsequent applications for commercial scale projects outside these areas to demonstrate that the proposed location meets the criteria used in identifying suitable areas.
Note 54:
54 Except for applications for the repowering of existing wind turbines, a proposed wind energy development involving one or more turbines should not be considered acceptable unless it is in an area identified as suitable for wind energy development in the development plan; and, following consultation, it can be demonstrated that the planning impacts identified by the affected local community have been fully addressed and the proposal has their backing.
This has effectively stopped new applications for onshore wind since 2016
In the recent fiscal event there is the following statement:
“The Growth Plan also announces further sector specific changes to accelerate delivery of infrastructure, including:
· prioritising the delivery of National Policy Statements for energy, water resources and national networks, and of a cross-government action plan for reform of the Nationally Significant Infrastructure planning system
bringing onshore wind planning policy in line with other infrastructure to allow it to be deployed more easily in England” (pg 21)
Spot the wind turbine! – industrial scene in the Netherlands.
Network
Cost of connecting to the distribution network
The cost of connecting to the network often rules projects out.
Making a connection with generation capacity no more than 16A in capacity accompanied with no more than 16A of connected storage can be done without first informing the DNO, the DNO needs to be informed afterwards with a G98 notification.
Any larger connection requires a G99 application, which needs to be approved by the DNO. Not only does this take time, there is a strong probability that at present the DNO will ask for payment for network upgrades, which could be not just at the current voltage, but at up to 2 higher voltages. It is not uncommon for this payment request to be £10k for an additional 5kW system.
Most projects are effectively limited to this size because the installer doesn’t want the overhead of making a G99 application. I believe that this has limited the deployment of rooftop PV.
A review called the Significant Code Review is currently being undertaken by Ofgem, which proposes that network upgrades be planned for by the DNO and most of the cost absorbed in network charges. Costs local specific to connecting to a site would still be born by the site, but otherwise costs would be limited to the current voltage, and should generally be much lower.
Presentation on Ofgem proposals for a Significant Code Review (SCR), which will encourage DNOs to plan for increased network demand, and limit the lottery of charges for upgrades falling on the first customer to trigger an upgrade.
Delay getting a connection
There are currently delays of up to 10 years getting a network connection above 1MW, this is severely delaying larger renewable projects.
Good description with video of Inertia and related concepts, and describes how a grid powered entirely by renewables can work with Grid-Forming inverters. New large renewable generators connecting in Texas have been required to do this for some time.
Accounting
Accounting for renewables
Currently electricity suppliers reconcile their generation on an annual basis, which means that it is possible to buy certificates (REGOs) for 100% renewable generation without actually buying anywhere near 100% renewable generation. This has lead most retail electricity suppliers to claim 100% renewable electricity.
Once generated electricity enters the network it contributes to the general carbon intensity of the network, it becomes unidentifiable. It would require physically separate supplies to guarantee renewable supply, which would not be practical. For most practical purposes a similar result could be achieved if electricity were accounted for in half-hour periods as recorded by smart meters. This would enable the consumer to identify the carbon intensity of each unit consumed. It would also enable suppliers claims of renewable percentages to be more credible.
The EnergyTag project seeks international agreement on a standard for generating hourly certificates for energy generation.
Selling locally generated electricity:
Local Electricity Bill seeks to enable selling of electricity locally by a generator directly without selling to an intermediate licensed electricity supplier.
A Smart grid is needed to ensure that local generation and demand are balanced, and that any difference is exported or imported from the wider grid as needed.
We examine the reasons behind the dramatic rises in electricity prices following the unprecedented rises in fossil fuel prices, and why reductions in renewable prices have had no effect.
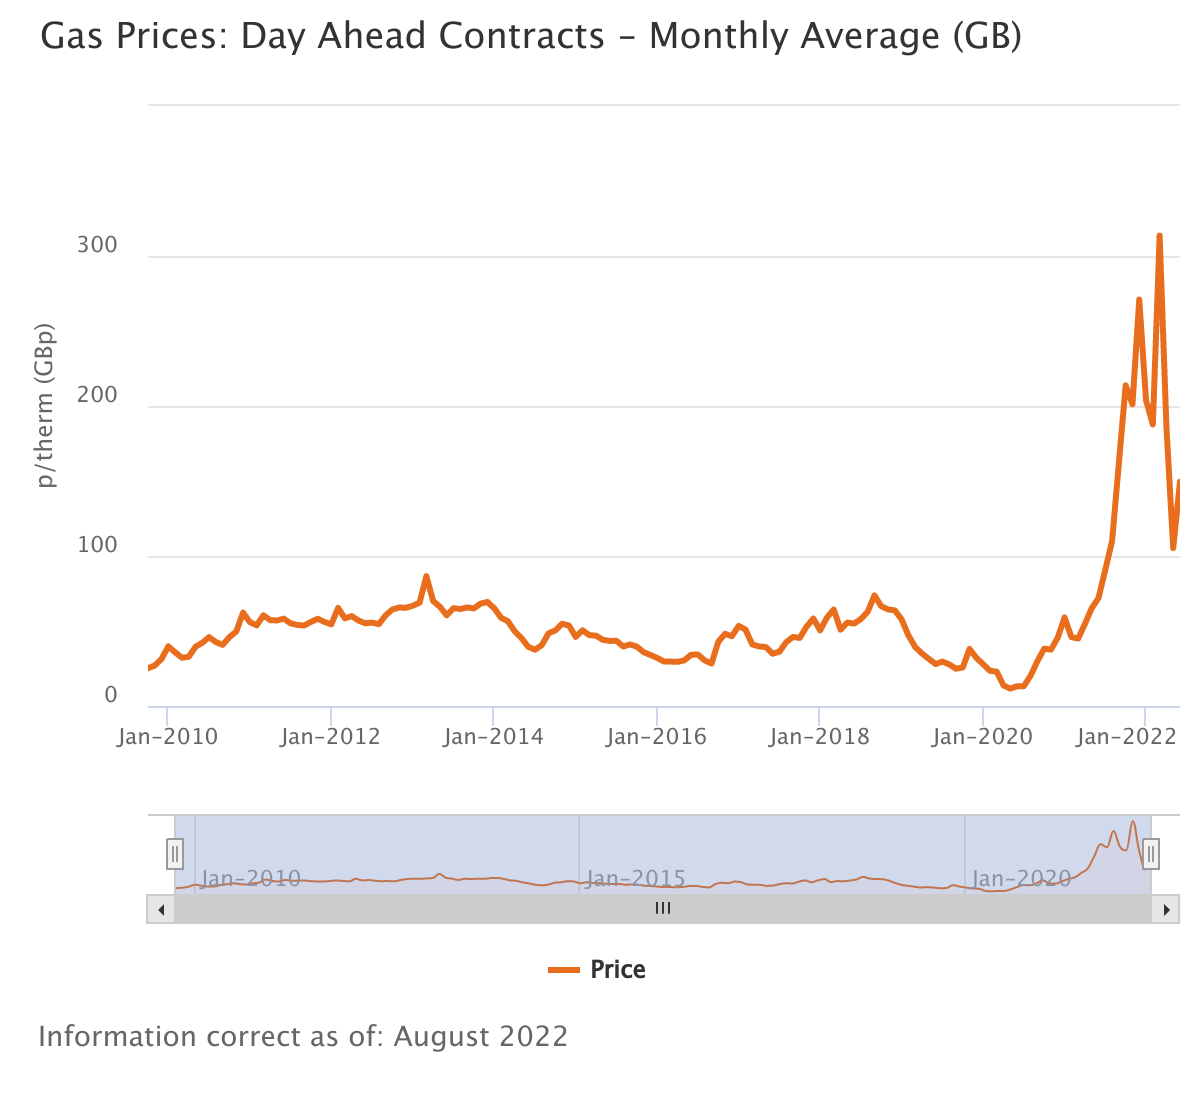
Fossil fuel prices have risen dramatically since 2021 and particularly since May 2022. The price of gas and oil in particular has soared. Gas is still used for a large part of electricity generation, as well as directly for heating. Because of the way the wholesale electricity market works, the price of gas normally sets the price of electricity.
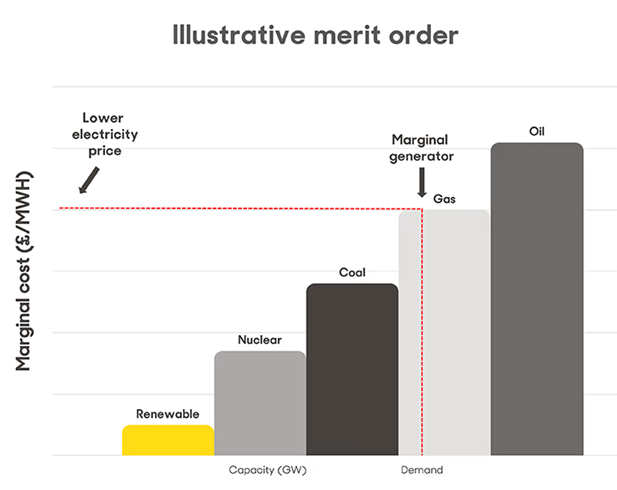
How the wholesale electricity market works (simplified)
Electricity retailers pay the wholesale price for electricity they sell on to retail customers. The electricity demand in any period needs to be balanced to generation. This balancing is done by a bidding process where generators bid to generate in a period. The Electricity System Operator (ESO) ranks the bids in merit order with the lowest price first, and then adds up the generation capacity until a marginal generator is found. The price paid to all successful bidders is the price paid by the marginal generator. Recently the marginal bidder has often been a gas generator.
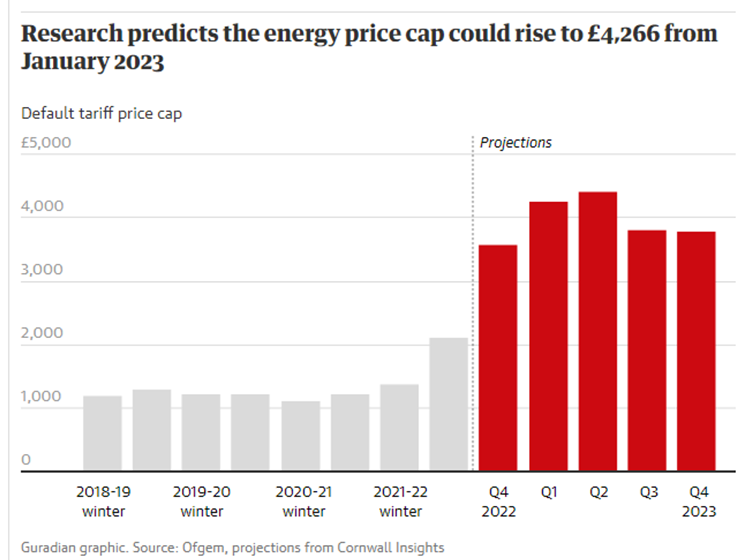
Domestic customers on standard variable tariffs are protected from excessive charging by a price cap, which is calculated periodically by Ofgem based on predictions of market prices for the upcoming period. In April 2022 the price cap rose sharply to 28p per unit for electricity, and in October 2022 it will rise to 52p. Consultancy Cornwall Insight predicts that the cap will rise a further 51% at the start of January to about 80p per unit, and a further 13% in April to about 90p per unit.
Ofgem cap methodology change
Historically Ofgem calculated the cap six monthly, based on forward prices wholesale price estimates. Recently wholesale prices have been volatile, and suppliers have had to pay more for electricity than was predicted. In order to avoid further supplier failures, Ofgem have introduced some changes:
The cap will be recalculated at 3 monthly intervals from October onwards.
A backwardisation calculation has been introduced which introduces compensation for the excess of actual wholesale prices for the previous period over those predicted in advance of the period.
These changes compensate suppliers for additional costs they have incurred and have the effect of increasing the cap more than would otherwise have been the case.
Energy Price Guarantee
Since this post was written the government has announced an energy price guarantee, which replaces the energy cap. This means that effectively the cap on electricity prices will be 34p.
You might have thought that the simple measure of boosting onshore renewables would have been an obvious step to shorten the period that the government had to finance this intervention. The government hasn’t done this, instead it is lifting the ban on fracking, launching a new round of oil and gas licencing, and carrying on with nuclear projects. None of these actions will make any difference in the next few years to energy prices, but they will certainly cause increased carbon emissions.
Hedging
Most domestic electricity customers expect to buy electricity at a fixed price per unit, very few would accept a tariff which offered a different price for each half hour period (to the author’s knowledge there is only one such tariff). This means that electricity retailers need to find a means of fixing the price of the electricity they offer for the period of the contracts they offer, to do this they buy contracts to supply electricity at an agreed price at a future date. This practice is known as hedging. The failure of a many smaller suppliers to hedge adequately in 2021 lead to the large number of supplier failures last year.
The cost of renewables
Between 2009 and 2019 the price of electricity from solar generation dropped by 89%, and the price of on-shore wind dropped by 70%. A similar thing has happened with off-shore wind.
This rapid cost reduction for renewables has resulted in electricity from gas costs roughly 4 times as much as from renewables.
Renewables have a high initial capital cost and low running costs. Initially subsidies were required to get the market established and get the benefits of scale. There is significant future price risk if renewables were to be funded based on future receipts, the cost of capital is substantially reduced if this risk is mitigated somehow.
Support methods for renewables
Early renewables were subsidised by the Renewables Obligation (RO) and Feed In Tariff (FIT), which are currently paid out of retail electricity bills. More recently renewables have been financed by Contracts for Difference (CfD), which now tend to reduce electricity prices. All domestic renewables are now privately funded. Given current prices some grid scale renewables are also being funded without subsidy.
Renewables Obligation
The RO requires electricity suppliers to buy a proportion of Renewables Obligation Certificates (ROCs) from generators registered with the RO scheme. ROCs are issued by Ofgem to registered generators. There is a monthly reconciliation to ensure that suppliers have either bought enough certificates or pay a penalty known as the buy-out price.
RO closed to new generators in 2017, but will continue to operate until 2037.
Each year BEIS calculates the amount of ROCs that need to be issued to meet proportions of renewables fixed in the 2015 Renewables Obligation Order (ROO). For 2022-3 the number of ROCs is set at 124.5 million. From this a rate of 0.491 ROCs per MWh is set for GB, this is a drop from 0.492 in 2021-2.
Projects remain in the RO scheme for 20 years, the scheme started in 2002 and closed in 2017, so we expect to see the number of generators in the scheme falling from now on, so the number of ROCs required will also drop.
ROCs are traded in the market, and are normally sold above the buy-out price set by Ofgem. Suppliers are prepared to do this because they receive a share of the buy-out money in addition to meeting their obligation.
The buy-out price is set by Ofgem each year by rules determined by the ROO and is linked to RPI. For 2022/3 it is set at £52.88/MWh
Feed In Tariff
Feed in Tariff is paid to domestic generators and smaller grid scale generators. It is paid regardless of how the electricity generated is consumed. The rate paid depends on when the scheme was joined and is inflation linked. The last FIT installations were done in 2019, though the rate was far lower than early installations in 2011.
Electricity generated under FIT must be measured by a generation meter. In December 2021 Ofgem published rules that must be applied when FIT registered plant is replaced or modified, essentially:
If the generation capacity is increased, then the meter reading is adjusted pro-rata when calculating the amount of FIT payable.
If storage is installed behind the generation meter, then it must not be possible for electricity to pass from the grid side of the meter to the generator side of the meter. (Otherwise it would measure electricity that hadn’t been generated by the plant).
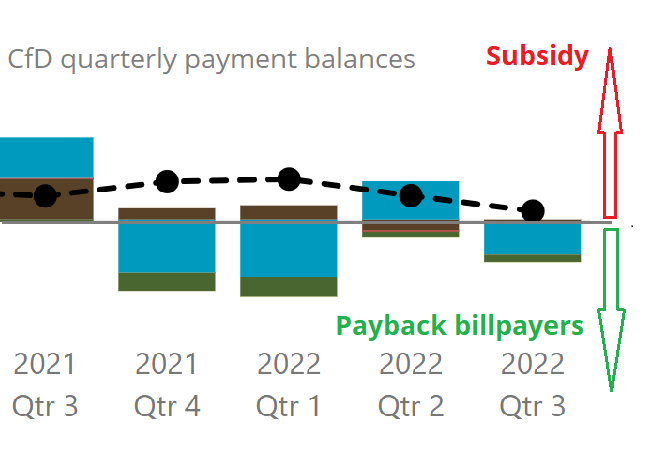
New renewables are supported by Contracts for Difference (CfD). Periodically there is a CfD auction where generators bid a strike price for the period of the contract. For each technology the auction is for an amount of generation. The result of the auction is a strike price for each technology. If the wholesale price does not meet the strike price then generator is subsidised from electricity bills. If the wholesale price exceeds the strike price, then the generator compensates electricity bills.
This subsidy is managed by a government owned company—the Low Carbon Company.
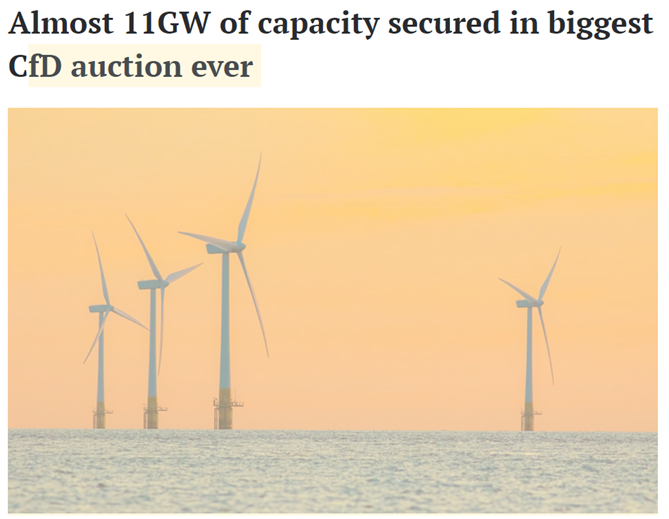
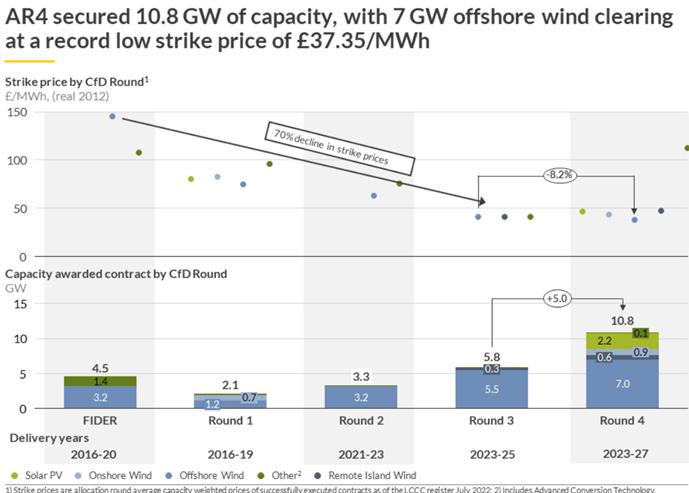
In recent CfD auctions prices have fallen, and record amounts of renewables have been contracted.
Since the end of 2021 the electricity wholesale price has mainly been above the strike price, so CfD has acted to reduce electricity bills. In a climate of higher wholesale prices this will continue.
As well as wholesale electricity costs, retail electricity bills also pay for network costs, social and environmental obligations, other direct costs, taxes and operator’s margin.
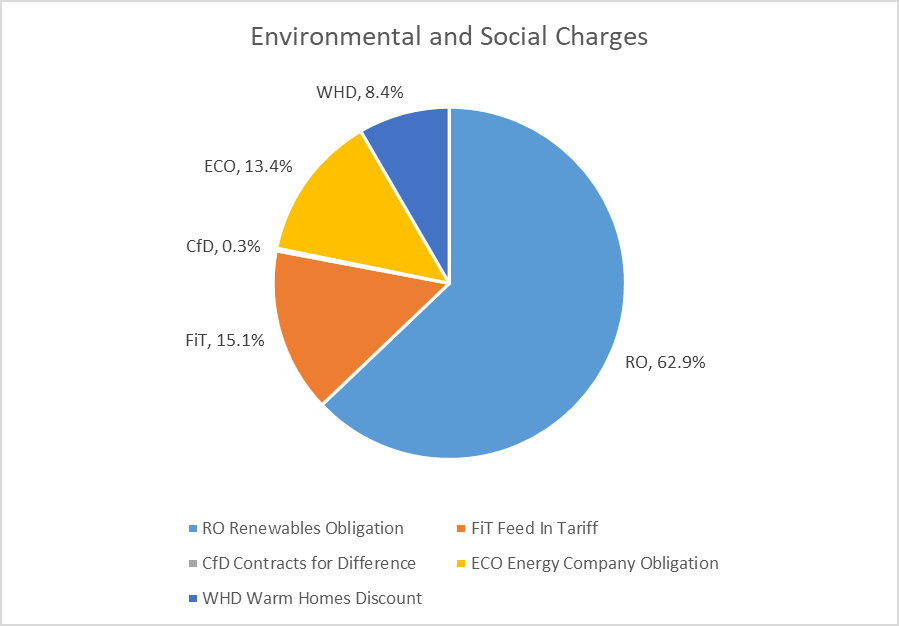
Environmental and Social costs aka Green Levies.
Environmental and Social costs are often referred to as ‘Green Levies’ and currently amount to about 12% of electricity bills. The breakdown of environmental and social charges is shown on the left.
RO and FIT schemes have now both ended, so the amount of generation in the scheme won’t increase and will start to fall, but payments are linked to RPI, so the costs will increase. These are both contractual agreements.
ECO and WHD assist those in fuel poverty to improve the insulation standards of their dwellings.
When a supplier fails another supplier is found to continue their supply. Other costs associated with the failure are shared between the remaining suppliers, who pass this on via electricity bills. This has resulted in a near doubling of standing charges for electricity this year. According to this article the cost of failed suppliers is estimated at more than £2.7bn.
Conclusions
The electricity market has grown to be very complex, this brief note doesn’t touch on many aspects of it. As with many things that have grown complex there is a temptation to think that it would be simpler to start again, if this is done it should be done with care.
BEIS has launched a consultation Review of Electricity Market Arrangements (REMA), which runs until October. This is far reaching, recognises some of the current problems, and could eventually achieve a more workable market, however, it is unlikely there would be any change from this for several years.
Following its Climate Emergency declaration three years ago, Teignbridge District Council has published and adopted Part 1 of its Climate Action Plan. Part 2 is expected later this year.
Action on Climate in Teignbridge (ACT) welcomes the long-awaited plan, believing it is an essential first step in delivering on the council’s commitment to be a carbon neutral district by 2025. It is excellent to see standards set, but ACT has concerns that the emission reduction targets included in the plan are based on outdated data and will not make the difference we need to see.
Part 1 of the plan sets out how the council expects to reduce carbon emissions in its own sphere, in things it owns, purchases, funds and supplies. Part 2 will cover the wider district, including transport, housing, businesses, land use, energy and infrastructure.
The plan includes 39 actions, four policies and 11 targets. ACT has no major problem with the actions or policies. It is primarily the targets that need further work.
Carbon emission targets are set by reference to a carbon budget. The budget sets a limit on the cumulative amount of greenhouse gases an organisation, a country or the world can emit that gives a significant chance of limiting global warming to 1.5C above pre-industrial temperatures. It is like a financial budget, where you set yourself weekly or monthly spending limits so you don’t go overdrawn.
In the case of carbon budgets, the limits are how much carbon can be emitted over a time period, to make sure we don’t trigger runaway climate change. We can’t afford the equivalent of an overdraft when it comes to the climate!
Carbon budgets have to be adjusted as the average global temperature rises and to take account of whether targeted emission reductions have been achieved. Global warming has now reached 1.2C and we are on track to reach 1.5C by the early 2030s, if not earlier. The tighter the budget, the more likely we are to limit global warming.
The Teignbridge plan states that the council aims to limit its cumulative emissions “to levels consistent with 1.5°C and well below 2.0°C of global warming”. This needs revising as, at the COP26 climate meeting held in Glasgow last year, governments agreed to make 1.5C the firm limit to aim for, due to the risks of allowing any further warming.
The basis for setting the council’s carbon budget also needs revision, as the budget calculation uses data from a 2018 study. That doesn’t sound too out of date, but there has been a significant rise in average global temperature since then. Moreover, setting targets for emission reductions based on this budget means they fall well below the UK government’s legal requirements.
ACT believes the council should use the government’s statutory carbon budget to set its targets. It would be even better if it used the Paris Agreement targets, as ACT has proposed.
There is a big difference between these various targets. The annual emission reductions required under the Paris Agreement (for a likely, or 67% chance of staying within 1.5C) are 10.4% year on year. To meet the UK’s statutory requirements (for a 50/50 chance), they are 7.9% year on year. The Teignbridge plan targets are based on a study that recommends a minimum carbon reduction of 4.2% flat rate.
There is another issue: the targets only include the council’s direct emissions. These are mainly from heating council buildings and fuel used in the council vehicle fleet. These are known as scope 1 and scope 2 emissions, and only account for about one-third of the council’s annual emissions. The bulk of the emissions, known as scope 3, are indirect, from stuff the council buys, mainly for building work and services they buy in.
The plan does have ambitions to influence the council’s suppliers with regard to scope 3 emissions, but they are not included in the targets.
Finally, while most of the 39 actions in the plan are good, some excellent, there is no indication of the expected emissions reduction for each action, or the timescale involved. ACT believes this should be addressed as soon as possible, and that a regular review of progress against the expected reduction for each action should also be part of the plan.
Teignbridge District Council still has work to do on its Carbon Action Plan.
The jolting rise in the price of energy should help focus minds on the urgent need to speed up the transition to renewable energy sources. We need to make that switch to reduce greenhouse gas emissions, but it would be good if it also helped reduce and stabilise energy prices.
That’s not guaranteed under the current pricing system for electricity, where the price we pay is mostly set by the market price of fossil fuels, even though these only generate around 40% of the energy we use each year. Renewables are now the cheapest source of energy and supply more than 40% of the UK’s annual electricity consumption. But some gas generation is needed most of the time. So electricity prices are still tied to oil and gas prices. That’s why they are currently so high, and set to rise further.
It looks like we need more renewable generation and a new pricing system, especially as electricity consumption is set to rise significantly as we seek to decarbonise our heating and transport. The government’s target is for the electricity supply to be net zero by 2035. This can only be achieved by a major increase in renewables and nuclear power, along with a big reduction in the energy we use. We need to cut out unnecessary consumption and retrofit our housing stock.
Onshore wind turbines and large solar farms are the cheapest ways of creating energy, green or otherwise. Wind has the advantage, though, of using far less land than solar and is more efficient. It also has the lowest ‘embodied energy’ per unit of energy generated– the energy required during manufacture– of any form of energy production.
The first wind farm in the UK was opened at Delabole in Cornwall in 1991. Between 2009 and 2020 wind energy in the UK grew by 715%, but most of that generation is onshore in Scotland and offshore, mainly along the east coast of England. Onshore wind was effectively blocked in 2015 when the government banned public subsidies for onshore wind farms. The ban was dropped in 2020, but there are still tough planning requirements.
The history of wind energy means existing sources are a long way from Teignbridge, involving electricity transmission losses. You may have noticed it can be pretty windy in Devon. Indeed, the South West is second only to western Scotland as the most exposed part of the UK. We should make the most of our natural advantages!
Teignbridge District Council agrees and recently consulted on potential sites for wind turbines in the district. Action on Climate in Teignbridge put in a response to the consultation supporting the creation of onshore wind sites, provided they minimise adverse effects on the environment. Badly designed wind farms can damage bird and bat populations in particular.
They can also be unpopular with residents. That’s partly why there was an effective ban for several years – wind turbines were regarded by some as a blight on the landscape, and noisy as well. On the noise front, wind turbines are now remarkably quiet. For planning purposes, noise from turbines must be shown not to add to the constant background noise levels for no further work to be required.
There is not much to be done about the visual impact of most wind turbines. Like electricity pylons, roads and housing developments, they are man made structures in the natural environment.
It seems we are more likely to accept new structures that are familiar to us, like roads and housing. This is despite them having a greater detrimental impact than wind turbines both visually and ecologically, not to mention their high greenhouse gas emissions. Roads and housing are also more likely to persist for a lot longer than wind turbines, if eventually we are able to generate our energy from other low carbon technologies. We could also limit wind turbine deployment if we become more careful about how much energy we consume and distribute energy better.
But even if we build wind farms wherever we can in Devon, taking into account factors such as whether there is enough wind, the proximity to the grid and protected nature areas, less than 2% of the county’s total land area would be occupied by wind turbines. That compares to 5% of land in Teignbridge that has been built on. That doesn’t sound too bad for a technology that will help meet our carbon emission reduction targets and potentially be a source of cheap energy.
Teignbridge District Council’s current Local Plan, which runs from 2013-2033, is being revised and extended to cover the period 2020-2040. Part 1, which specifies the policies associated with new developments including renewable energy, was consulted on in 2020. The result of the consultation and any changes coming out of it are as yet unpublished. Part 2, consulted on in mid 2021, covered what TDC describes as major sites for housing and employment.
The current consultation is on Part 3, covering sites for renewables (wind and solar), small scale housing and travellers. The consultation closes on 24th January 2022.
ACT is not responding to specific sites, where these are listed, unless we have identified a particular concern in relation to climate change or ecological impacts. Instead, our response is to the broader aspects of these proposed sites and the associated policies/criteria that govern their selection.
We encourage everyone to respond individually, especially regarding specific sites they are familiar with. It is important to include comments that address the criteria identified by the council in the consultation. Not doing so may result in the comment not being given the weight it may otherwise deserve.
Although you are strongly encouraged to respond online, ACT’s response will be sent by email to localplanreview@teignbridge.gov.uk. This is because there is no facility to do this using the online facility other than for solar PV where there are no individual sites identified.
oOn 15th November Teignbridge District Council launched the third part of its consultation on the Local Plan. This third part of the consultation covers Renewable Energy, Gypsy and Travellers and Residential Sites Options. The consultation closes on 24th January 2022. The renewable energy part of the consultation covers site options for wind energy as well as policies in respect of wind and solar energy.
ACT plans to respond to the sites and policies for wind and solar energy. We encourage you to do this direct to TDC. We also welcome your views and comments, so we have included a facility for you to do this.
We believe that renewables are an essential part of the overall effort to remain below the climate tipping point, caused by temperature rise of more than 1.5oC. For more information on Climate Change please refer to Why this is an Emergency. To read about actions needed, please see our Energy & Built Environment webpage.
When responding to the TDC online consultation, each wind site has a number of criteria against which free text can be entered. You can also comment on policies associated with the potential solar areas identified for Teignbridge.
To help you see all the information provided by the consultation, as well as other related information, we have extended our Local Plan mapping data web page to cover proposed wind sites. Please read the instructions first to learn about how to use this data and how to enter comments you’d like to share with ACT against each site.
Although solar PV, especially with Li Ion battery storage has its part to play, this is mainly for smaller behind-the-meter applications. Ideally rooftops or ground mounted close to buildings. The following headings therefore represent our current views on the Part 3 consultation for wind. We welcome your input on this.
Why we need local wind
In order to stand any chance of restricting global temperature rise to 1.5˚C above pre-industrial levels everyone needs to cut their greenhouse gas emissions as fast as possible. According to Our World in Data 73.2% of global greenhouse gas emissions are attributable to burning fossil fuels to generate energy. To rapidly reduce emissions from energy production we all need to:
Reduce energy consumption, i.e. cut out waste and reduce non-essential consumption.
Increase the efficiency of the devices/processes that use this energy, e.g. A rated or higher.
Electrify transport, heating and industrial processes as these are the main consumers of fossil fuels. Electrification is currently the most effective way to decarbonise energy as renewables become more widely deployed.
Electrification of transport and heat will increase electricity demand, if sufficient low carbon generation isn’t added, this could cause the Carbon Intensity of grid electricity to increase, the opposite of what is needed. This is because more gas will be used to supply the additional energy needed.
The first wind farm in the UK was opened at Delabole in Cornwall in 1991. Between 2009 and 2020 wind energy in the UK grew by 715% , but most of that generation is on-shore in Scotland and off-shore, mainly the east coast of England. These are a long way from Teignbridge involving electricity transmission losses.
On-shore wind is a mature technology, which is also currently the cheapest source of electricity and has one of the lowest Carbon Intensities. It is needed as part of the energy mix and can be deployed now.
Teignbridge currently has negligible wind generation, but has significant solar generation in the sunnier summer months. In winter, just as energy is needed for electrified heating (e.g. heat pumps), the local Carbon Intensity of the electricity supply is at its highest. If supply and demand were better matched for more of the time, Teignbridge’s Carbon Footprint would be reduced. Wind generation is highest during the colder months.
How much of Teignbridge’s demand could be generated
The consultation estimates that an additional 10,000 homes would require 66GWh of electricity per year, so each home is estimated to consume 6.6MWh of electricity per year. If this level of consumption were repeated across all homes in Teignbridge after full electrification of heating and transport, then annual demand would be in the region of 462GWh.
The University of Exeter has estimated the generation from the sites identified in the consultation would be 217GWh using a mix of 1MW and 2MW wind turbines, this would be 47% of Teignbridge’s estimated electricity demand.
Wind turbines are designed for an IEC wind class from I for the strongest winds through to IV for the lowest wind speeds. The site with the strongest winds in Teignbridge has class II winds, most are III or IV. Turbines designed for class I winds have much smaller rotors and towers than those designed for class IV for the same power rating.
We believe that it would be more effective to place higher rated turbines at sites with the strongest wind classification. This is not only more cost effective but also minimizes some of the potential adverse impacts of having wind turbines in Teignbridge. We believe such an approach would probably meet or exceed all of Teignbridge’s estimated electricity demand.
We have placed turbines in line with the consultation to illustrate their potential impacts. Using Local Plan mapping data web page, you can see the example turbines placed to comply with various restrictions. Two example scenarios can be selected, those specified by the consultation (default scenario) and fewer higher rated turbines. We have done this to illustrate the reduced noise impact of these higher rated turbines.
Proximity to Housing- Noise from wind turbines
Modern wind turbines are remarkably quiet compared to a decade or more ago. We have provided visual outlines where the sound power from the turbines is just lower than 45dBA, 40dBA and 35dBA. The noise level inside a quiet library is 35dBA, 40dBA is the level in a quiet rural area when the wind is not blowing. When placing turbines on the maps, the default noise level at neighbouring properties is set to be less than 40dBA.
Many of the proposed sites have a relatively high ambient noise level, often from road traffic and proximity to built up areas. While an ambient day time noise level in some location may well be 35dBA or less, this is quite unusual in the vicinity of the proposed sites and would need to be considered if and when these sites are developed.
Noise from wind turbines is site and wind speed/direction dependant, so the mapping circles we have provided are only indicative. More detailed and specific measurements will be made as part of any and every turbine application, so the local community will have the ability to comment.
“Few people are seriously annoyed during the daytime at noise levels below around 55dB(A)Leq outdoors. Noise levels during the evening and night should be 5 to 10dB lower than during the day”
Ecological and Land Use Impacts
The main ecological concern of wind turbines relates to bats and birds. For both bats and birds there are mitigation solutions, which suggests that a strategy of monitoring and mitigation is likely to be effective.
Apart from the relatively small loss of land needed to support a wind turbine and gain maintenance access, there are no other significant impacts to land use or its ecological value.
Bats
Exeter University undertook research on the interaction between bats and wind turbines for DEFRA by monitoring a number of wind sites, a range of wind conditions and recording bat fatalities. More accessible references, are:
It seems that some relatively simple mitigation measures can allow wind turbines to generate most of the time:
Turbines only turned off when there is a high risk to bats (example low wind, summer evenings), turbines can now have this automated.
Ongoing monitoring to refine the circumstances when turning off needs to occur.
Absence of bats at the pre-construction stage is not a good indicator of their absence during turbine operation. Subsequent mitigation is more likely to be effective than pre-construction surveys.
There are devices that emit an ultrasonic signal, which effectively blocks the bat’s radar, so they do not approach the turbine. This is mounted on the turbine
Birds
Several references suggest there are much higher numbers of bird deaths in general from cats, collision with windows and traffic compared to deaths from wind turbines.
This reference discusses both bats and birds. It suggests that large birds are more at risk than smaller ones. It reports Norwegian research where turbines with one blade painted in a contrasting colour has dramatically reduced fatalities.
Infrastructure and Highways Impacts
These include site access during construction, especially for larger turbines. The consultation states that these will be considered on a case by case.
Connection to the electricity network is a key factor. There does not appear to be much consideration for this in terms of site selection. We have included mapping information on current electricity distribution/transmission lines and sub-station.
The distribution network operator Western Power Distribution (WPD) has been made aware of these potential sites. This information should allow them to better consider strategic network reinforcement, something they are not currently required to do by the regulator Ofgem.
Landscape and Heritage Impacts
Undoubtedly most wind turbines will have a visual impact. Like electricity pylons, roads and housing developments, they are manmade structures in the natural environment. The question we need to answer is what the balance is between the benefits and the detriments.
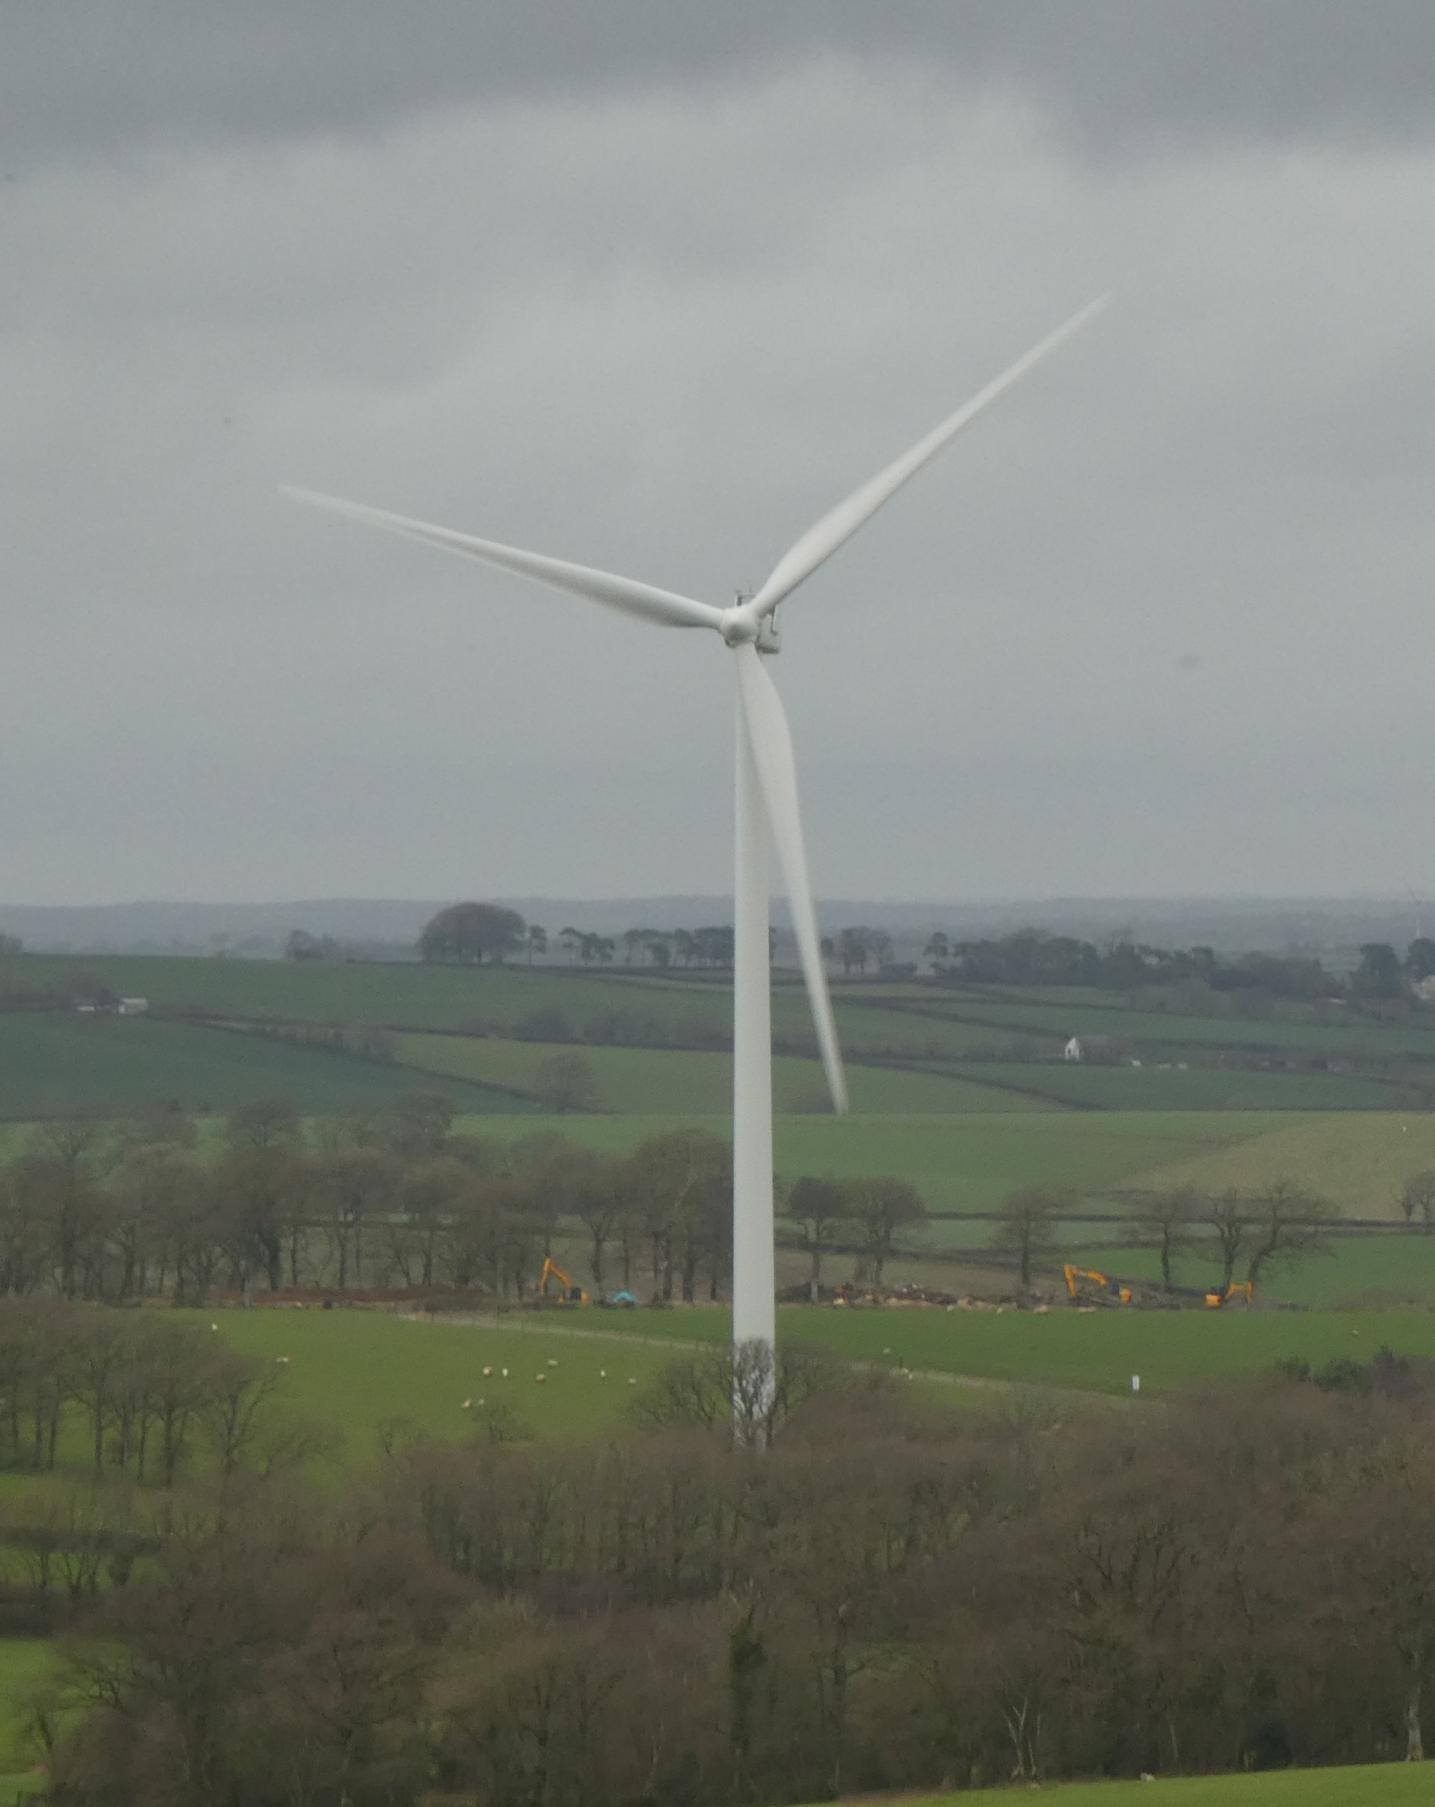
To minimise their visual impact, wind turbines are painted white or grey to blend into the sky when viewed from the ground. The lower part of the mast can be painted to allow this to blend into the surrounding’s natural structures. For safety reasons wind turbines need to be visible from overhead low flying aircraft.
We are more likely to accept new structures that are familiar to us, like roads and housing. This despite them having a greater detrimental visual, ecological and of course greenhouse gas emission impact compared to wind turbines. Road and housing are also more likely to persist for a lot longer than wind turbines, if eventually we are able to generate our energy from other low Carbon technologies. We could also limit wind turbine deployment if we become more careful about how much energy we consume and distribute energy better.
Other Notes
This space is made available in the on-line consultation for making comments on the benefit and impact of wind turbines not covered above.
We believe that if we are to avoid the existential threats resulting from Climate Change, on-shore wind turbines will be necessary. They are by far the most effective renewable technology available to us now. Nothing comes without a degree of negative impact, we need to minimise the impact of wind turbines. The consultation materials list many of these safeguards, you can also read general references to these on the internet, e.g. for on-shore wind.