
Hello everyone! I’m not quite sure where 2025 has gone — but here we are! As we head into the festive season, I hope you can find a quiet moment to sit down with a cuppa, watch the birds, and catch up on all the great things that have been happening over autumn and early winter with the Teignbridge Wildlife Warden group.
If you’re up for a post-Christmas dinner wildlife treasure hunt, take a look at the article on winter butterfly eggs — or, if it’s a good stomp you need, read all about natural food management at Yarner Woods and then go and see it for yourself!
You’ll also find details of some of our plans for the colder months ahead …..
In this newsletter:
- Autumn WW gathering at Moor Barton Wilding
- Natural flood management walk at Yarner Woods
- Fungal foray with Dr Christian Taylor
- Winter collaboration chats
- Dormouse surveys for TVFF
- Butterflies in winter: a winter treasure hunt!
- Training sessions with TDC to increase biodiversity in public greenspaces
- Behind the scenes of wildlife enforcement
- DWT Pine Marten Project: Looking for camera trap enthusiasts for a pilot scheme
- Calling for your Wildlife Warden stories
- Dates for your diary
- Round up of Wildlife Warden activity across Teignbridge
Autumn WW gathering at Moor Barton Wilding
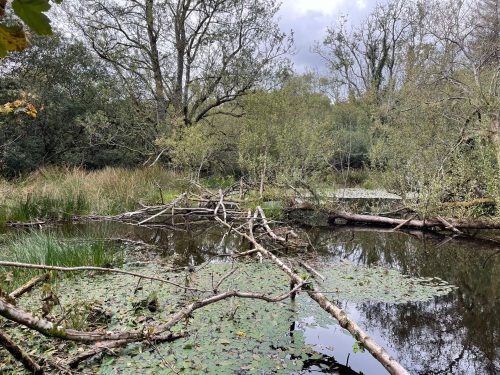
Back in September, we enjoyed a fabulous visit to the Moor Barton Wilding site, located between Moretonhampstead and the reservoirs near Bovey Tracey. Over fifty Wildlife Wardens and friends joined us for the day and thoroughly enjoyed learning about the site’s history and how it is now being managed for wildlife.
We took part in two guided walks and were all thrilled to step inside the seven-acre beaver enclosure (equivalent to about fourteen standard football pitches) and see the incredible dams the beavers have engineered. The valley has been transformed from a narrow, one-metre-wide stream into a series of large ponds brimming with wildlife, mosses, and ferns. The enormous increase in water-holding capacity will greatly reduce flooding downstream and help lessen the impacts of drought.
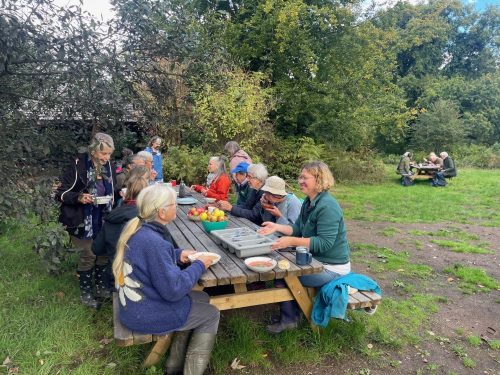
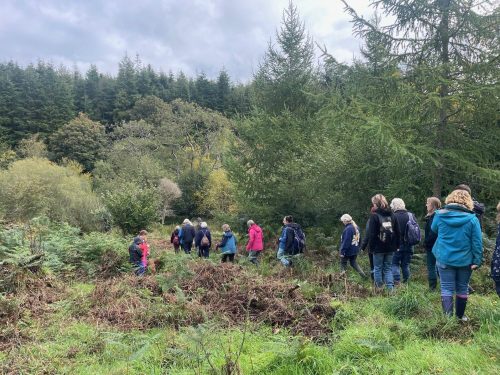
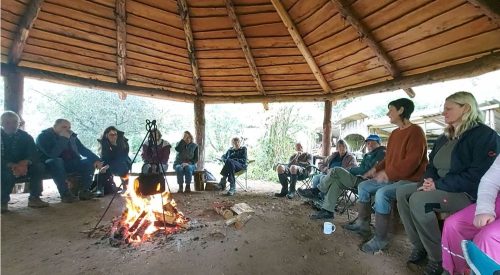
After a shared feast of soup and cake, we exchanged updates on recent warden projects and shared ideas and experiences across the group. In the afternoon, some people headed out to remove tree guards—an ongoing task with the 8,500 trees planted back in 2010–11! Some trees were literally bursting out of their guards, so it was very satisfying to “free” them!
A huge thank-you to all the wardens who came along, and to the team at Moor Barton for making it such a memorable day. Also, thank you to Ipplepen WW Mabel, who created a fab video which captured the day.
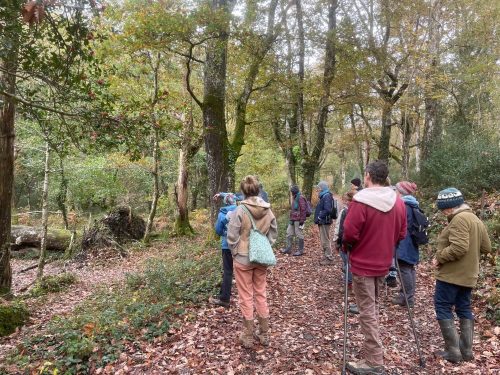
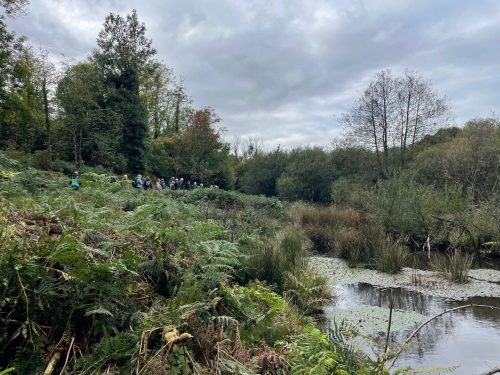
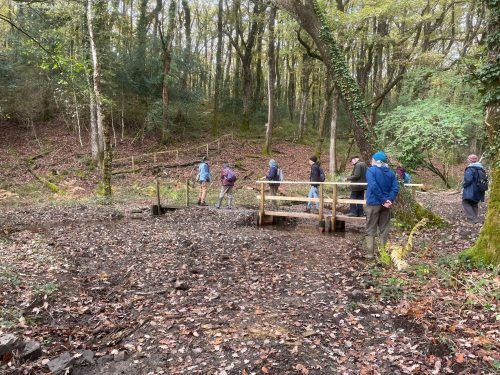
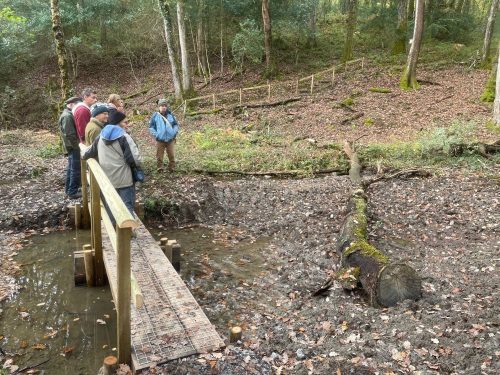
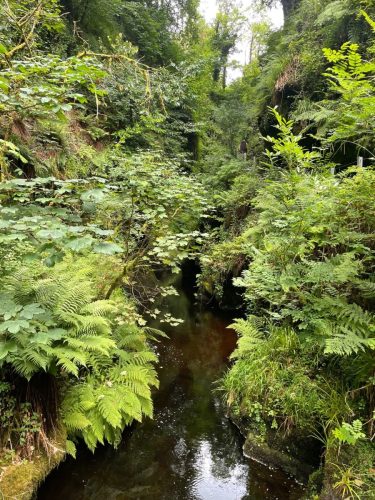
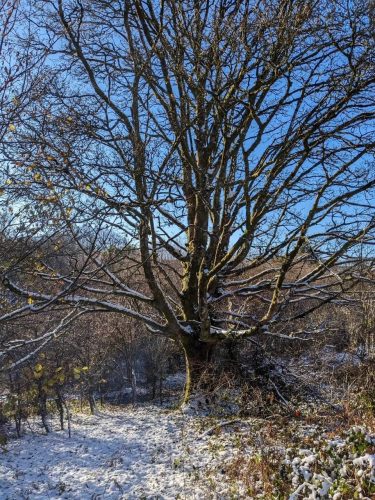
Natural flood management walk at Yarner Woods
In October, we visited Yarner Wood and were led by Albert Knott on a really informative and enjoyable walk focusing on the Natural Flood Management (NFM) project. Until recently, Albert worked for Natural England at Yarner Wood, and we were very grateful to him for sharing his incredible knowledge and insight into the area.
“Sorry folks, but climate change is happening,” were Albert’s first words. We are now seeing extreme rainfall events, where unusually large volumes of water fall over very short periods. This water hits the soil and runs rapidly across the surface, damaging wildlife habitats and creating flooding downstream. Modelling has shown that the floodplain around Bovey Tracey is particularly vulnerable. One possible solution would be to build flood defences for the town, but this would be hugely expensive, potentially risky, and would offer little additional value, for example for wildlife.
The alternative is to tackle the problem upstream by using natural methods to slow the flow of water higher up, preventing it from rushing straight down into the Bovey basin. This approach has positive impacts for flood prevention, drought resilience, and wildlife, and is far cheaper than constructing man-made flood defences. Unsurprisingly, this second option was chosen, and the Environment Agency funded the project, working along two stream systems that feed into the River Bovey.
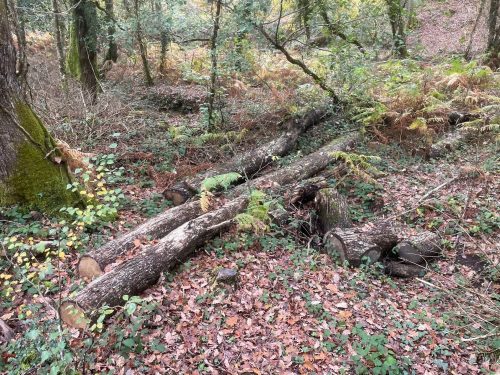
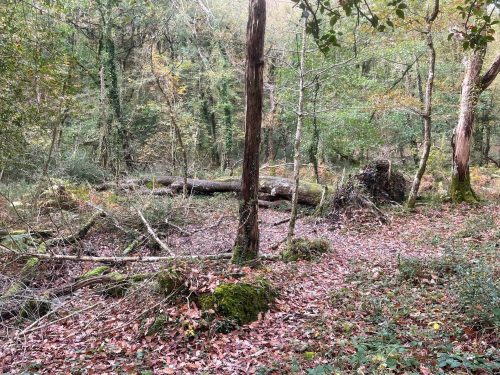
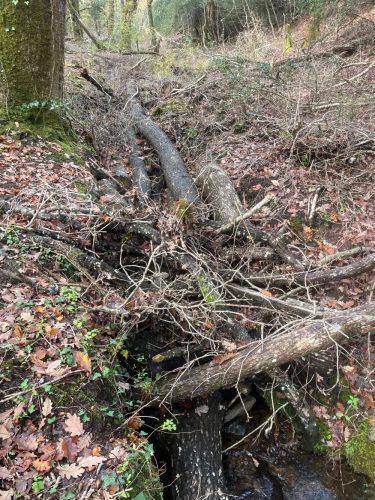
The key to natural flood management is creating natural interventions that slow the flow of water and encourage it to spread out when volumes are high. These interventions are not intended to stop the water completely, but instead to slow it and cause it to spread over a wider area, reducing the risk of flash flooding while also helping retain water during prolonged dry periods. This type of habitat engineering is something beavers naturally do through their impressive dam-building activities. However, as beavers are not present at Yarner Wood (yet!), humans have had to channel their inner beaver and take on this role.
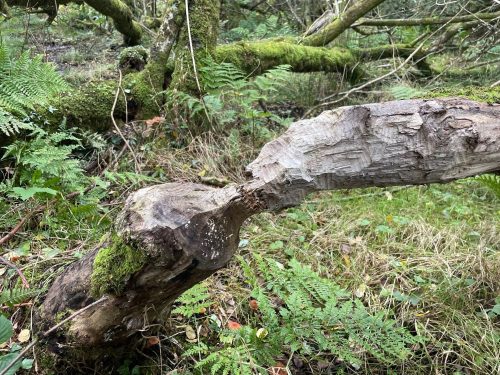
Yarner Wood is predominately a sessile oak woodland, with most trees roughly the same age, and structure. With so many young trees of a similar age, there are not enough falling naturally, so one of the key actions at Yarner Wood has been the strategic felling of trees. This has multiple benefits – trees felled across river channels act as natural interventions that slow water flow, while the resulting breaks in the woodland canopy allow dappled light to reach the woodland floor giving rise to a richer variety of plants and therefore other species. Honeysuckle, for example, is an important nesting material for dormice and also a food source for the white admiral butterfly. These open woodland areas are also vital for lichens and bats. It also allows for cut stumps to coppice or young saplings to grow – creating a new understory while the remaining trees grow older, therefore diversifying the age structure of the wood.
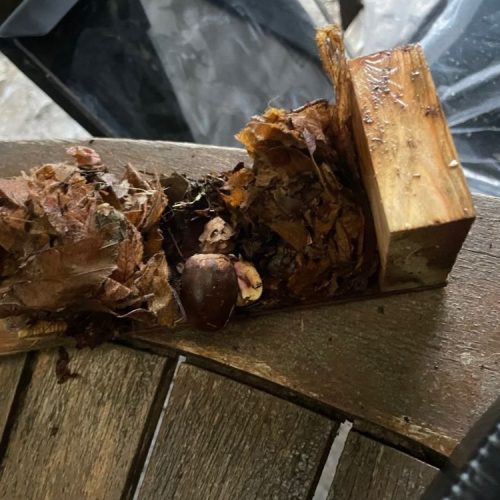
When a tree falls naturally, the lifting of its roots creates a large hollow where water can collect, providing additional habitat and water retention. The value of this process was recognised, and where possible, trees were pulled over rather than just cut to replicate this effect. Trees were not only felled and laid across stream channels, but logs and brash were also wedged in place, running in line with the water flow. When Storm Bert hit in November 2024, the team could see that even more of this work was needed across the site.
So, what about fish, you may ask — do these obstacles in the water channels cause problems? The short answer is no. Fish can easily wriggle through these naturally gappy structures and will actually benefit from more stable water levels during both heavy rainfall and drought conditions. It is important that the low flow rates are allowed to continue as well.
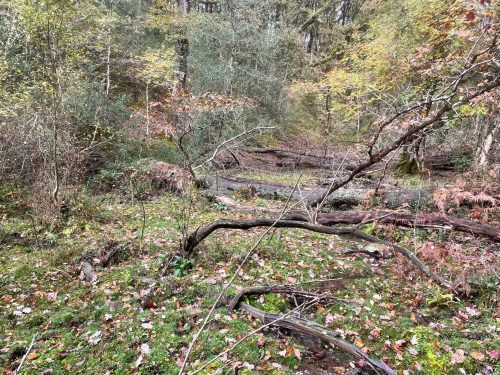
When we visited, the preceding weeks had been fairly dry, so we didn’t get to see the NFM measures in action. However, as I sit and write this with rain pounding down, I am itching to go back and take another look. I would strongly encourage everyone to visit and take a stroll, as it is truly impressive to see habitat management like this in practice. It is also well worth visiting at different times of year to fully appreciate the new habitats created by this work.
Thank you to Albert for helping us discover so much about this project. It is fantastic that Yarner is now an example site for others to learn from and, hopefully, take these ideas to other river systems as well as other parts of the River Bovey, as this work is just the beginning….
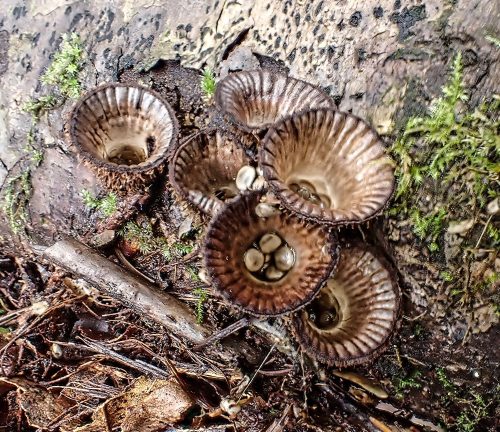
Photo credit: Helen Harding
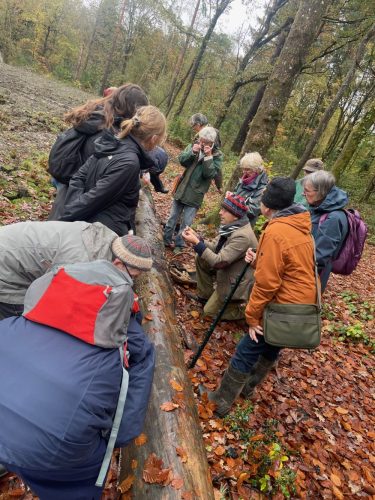
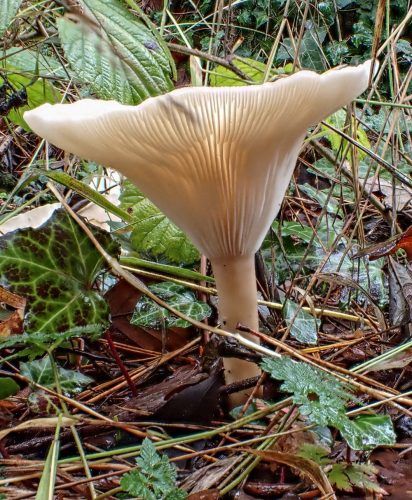
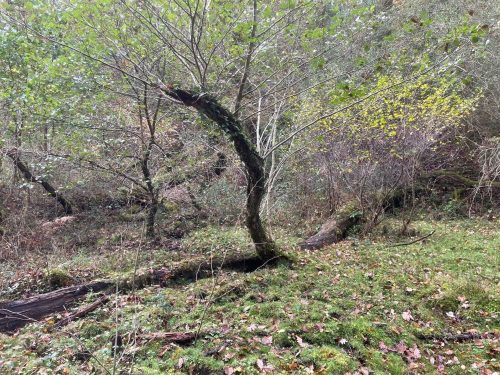
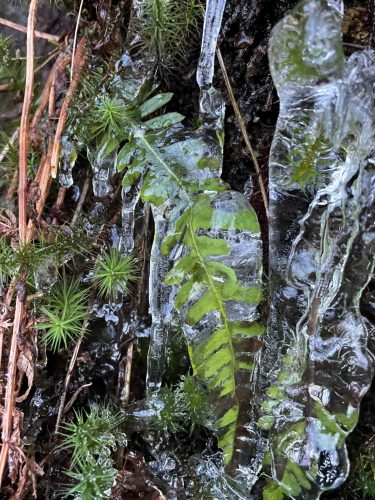
Fungal foray with Dr Christian Taylor
In November, Dr Christian Taylor led around 20 WWs on a fabulous fungal walk at Stover. In truth, calling it a walk is generous — we only managed a 500-metre loop from the visitor centre, as there was just so much to see and talk about that we barely got anywhere!
Dr Christian was a fantastic guide, with enormous amounts of enthusiasm and knowledge. He also said how much he enjoyed talking with people who were interested in the wider fungal world and its relationship with nature, rather than focusing solely on edible species.
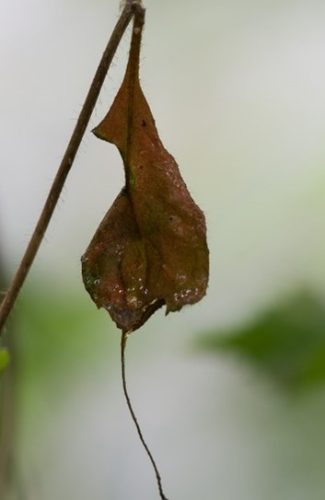
One fascinating phenomenon we discovered was the “green island effect,” seen in some leaves during autumn. Fungi living inside a leaf can keep small patches green while the rest of the leaf turns yellow. These green areas continue to photosynthesise, providing a steady supply of sugars and nutrients for the fungal mycelium.
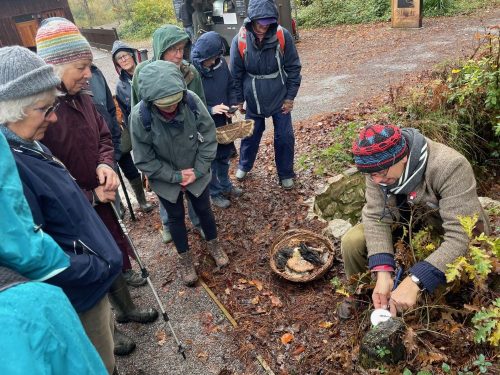
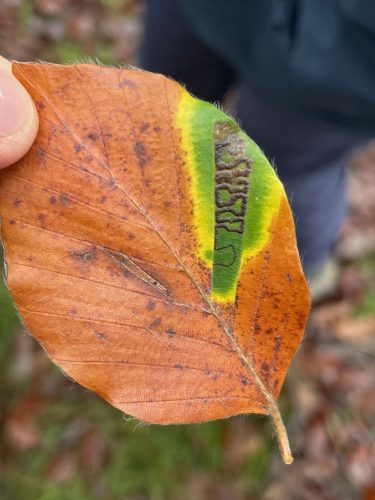
Photo credit: Helen Harding
WW Helen also shared that leaf-mining moths can produce a similar effect. The moth Stigmella tityrella was responsible for the striking pattern and colouration seen in the leaf we found on the walk and shown in the photo above. Helen explained how “the larvae use bacteria to produce a chemical that mimics a plant hormone. This prevents chlorophyll from breaking down and stops nutrients being withdrawn from that part of the leaf. The green patch then continues to feed the insect, even after the rest of the leaf has died or fallen.”
The group came away with many highlights, and the walk felt like a brief glimpse into a much bigger world, which will hopefully inspire many of us to delve further into.

Winter collaboration chats
As we head into the gloomier months, we hope to bring some cheer with a series of online evening meetings for Wildlife Wardens, and anyone else interested. With 160 WWs across Teignbridge, we have a huge pool of knowledge and experience. One of the great strengths of this network is the way we can share information, tackle challenges together, and spark ideas across parishes – this ripple effect is a great way to multiply our actions.
These informal winter chats will be a chance to hear what others have been doing, swap tips, and ask questions. We’re a friendly bunch, so it would be lovely to see lots of familiar faces on screen! For each session we will have a few wardens with experience of the topic who can share insights and help answer questions. Even if a topic doesn’t seem directly relevant to your parish, you may still pick up useful ideas—or share something others will value, so please do join us if you can!
Collaboration Chat Topics – all meetings will start at 7.30pm ONLINE:
- Working with your Parish Council – Wednesday 14 January
Many WWs are working closely with their parish councils, and some are councillors themselves. So bring your thoughts and questions and we can discuss building positive relationships. - Behind the scenes at ACT WWs – Tuesday 27 January
Find out more about what Audrey and I have been working on and the wider projects WWs are involved with—think of it as an interactive newsletter! It’s also a chance to tell us what else you’d like us to do.
- Running a wildlife open garden event or competition – Tuesday 10 February
Several parishes ran events last year which are great for raising awareness and having conversations about helping wildlife in gardens. Come along to find out more about how this might work in your parish. - Running a church or school bioblitz, including moth breakfasts – Monday 9 March Many wardens have been working with local churches and schools. Bioblitz events are a fun way to record local wildlife, raise awareness, and plan future management. Hear from people who’ve already done it and get inspired.
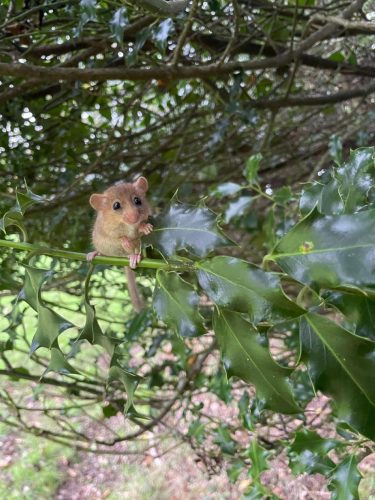
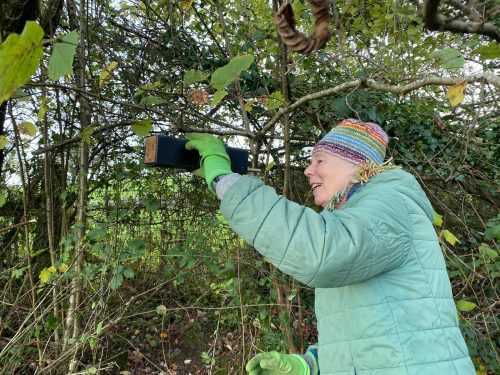
Dormouse surveys for TVFF
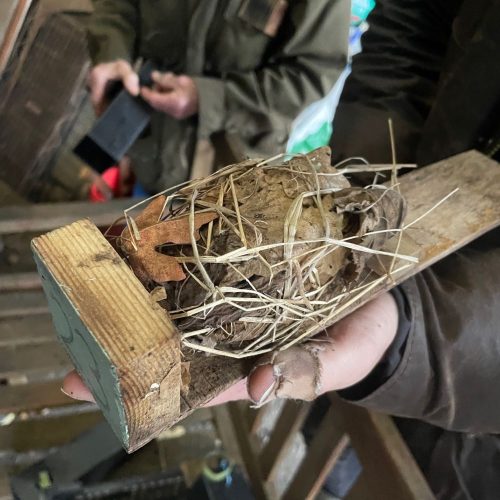
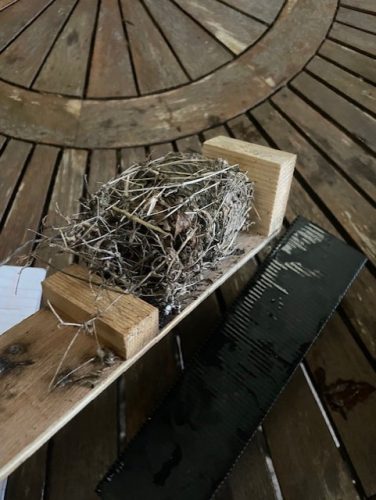
A group of Teign Valley Wildlife Wardens has been supporting the Teign Valley Facilitation Fund project by helping landowners and farmers carry out wildlife surveys on their land. The dormouse survey aims to find out whether dormice are present on the farms which will feed into further discussion around hedgerow management and connectivity across sites.
Over recent weeks, the busy team has been out collecting the dormouse nest tubes they placed in hedgerows earlier this year, and on one wet, windy morning a few of us joined expert and WW Sue Smallshire to take a closer look at them. We learnt how to tell the difference between the beautifully woven dormouse nests and the more haphazard constructions of wood mice. Of the 250 tubes checked so far on 5 different farms, 14 dormouse nests and 18 wood mouse nests have been found. With a couple more farms still to review, we’re keeping our fingers crossed for a few more dormouse finds—very exciting! If you would like to get involved with this project in the future, drop me an email.
Thanks very much to WWs Tess, Shira, Julia, Lucy, Jo and Sue for all your hard work!
Butterflies in winter: what you can find at this time of year
Thank you so much to Kevin Barstow for writing the WWs this excellent article all about winter butterfly egg searches.
You would think that winter is a quiet time for lepidopterists (those that study butterflies and moths) like myself but there are three butterfly species that can be found if you know where to look.
The Purple Hairstreak is our commonest hairstreak and often overlooked. The caterpillars feed on all our species of oak and it’s the eggs that can be found during the winter months. They are laid in the oak canopy in full sunshine and partly sheltered from the wind. I often search for the eggs after a period of stormy weather when the top small branches have broken off and fallen on the forest floor! The eggs are laid at the base of a fruiting bud at the end of July, the caterpillars not hatching out until March when they bore into the heart of these buds.
The Brown Hairstreak is a much less common butterfly but have strongholds in Devon, SW Wales and west Weald. On the GB Red List it is considered vulnerable. It is found where there is blackthorn growing on scrubland, along hedgerows and on the edges of woodland. Its decline has been linked with hedgerow clearance and annual flailing that removes the eggs. To see the adult during August to September, you will need to find a ‘master tree’ where the hairstreaks congregate to mate. They generally use an ash tree, generally growing near the lowest point of the basin of countryside that contains a colony.
Eggs are laid in August/September on one year old blackthorn branches growing from a two year old stem. They are usually found about 1 – 1.5metres off the ground and are laid at the base of the 1 year old branch.
During the winter blackthorn bark darkens and as the eggs are white they stand out. Interestingly, the caterpillars that hatch out in March and feed at night can be easily seen by using an ultra-violet light torch. Although in text books it describes eggs as only being laid below 200m, I recently discovered eggs on Mardon Down at an elevation of 300m. Studying the 2500 records of this butterfly in Devon, it appears that in this county, since the early 1990s they are also being found between 250 and 300m elevation, albeit my record at Mardon Down is the only one found at 300m.
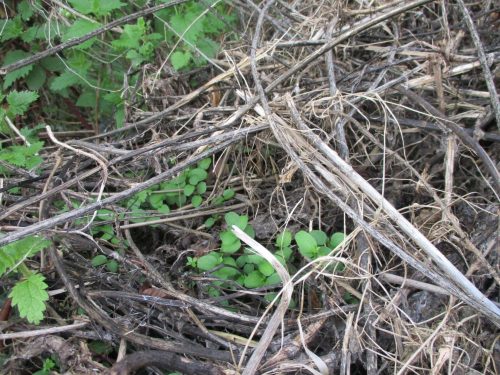
The third butterfly species that can be found during the winter months is the hibernaculum of the White Admiral caterpillar. White Admirals are woodland butterflies and again spend most of the time, high up in the canopy of oak woodlands, albeit occasionally they come down to feed on bramble flowers. Eggs are laid on spindly honeysuckle and often choose straggly, trailing wisps that dangle in the half light around a tree trunk. The caterpillars hatch out in July and in the autumn makes a hibernaculum (shelter) by fastening the stalk of the leaf to the stem with silk to stop the leaf from being shed. It then chews off the outer two thirds of the leaf before folding the remainder over the mid rib.
So despite the shorter, colder, wetter days of winter, I would encourage anyone to look out for these three species. Kevin Barstow, Dunsford
Continued training for the TDC contractor team
Audrey and I continue to have ‘bite-sized’ meetings with the Teignbridge District Council’s Idverde team, who look after many of our public open spaces.
Run over a coffee before the team heads out for the day, these sessions offer a relaxed opportunity to share ideas and information on supporting—and hopefully increasing—biodiversity across the sites they work on. It is also an opportunity for us to hear about the challenges the team encounters on site.
Heading into autumn, our topic was all about creating micro-habitats and winter refuges in public open spaces. We talked about spotting opportunities for small habitats — such as leaving dead wood, leaf piles, seed heads, or standing stems — and the benefits of leaving soft edges around hedges, trees and damp areas. We also chatted about how contractors may need to think creatively at this time of year and leave areas that could (hopefully!) develop into good habitats for the next season. Finally, we highlighted habitats that need careful management in public spaces, such as brambles, large nettle patches near play areas, and hazardous plants, to ensure sites remain safe and accessible for everyone.
In November we were asked by TDC Greenspaces to discussed the important topic of pesticides, and had a really good two-way discussion with the contractors about it. We talked about how insecticides, herbicides and fungicides impact an ecosystem and revisited a previous theme about “seeing the things in nature you love”. It may be that a native plant seen as a “weed”, or a target insect, is in fact a valuable food source for other wildlife. To continue seeing the things in nature that we love, we need to support the whole complex web — even those things we might see as a “problem”.
We also spoke about the growing body of independent research around the potential human health implications of exposure to these chemicals, as well as the PPE and training contractors require before using them. Teignbridge District Council is working towards using these harmful chemicals as little as possible, and we chatted about possible alternatives, including our role in raising awareness of the benefits of “weeds” and accepting them where possible. TDC do not use insecticides which was great to hear.
Behind the scenes of wildlife enforcement
We were very grateful to Colin Taylor for giving the Wildlife Wardens a great insight into his role as an enforcement officer for Natural England last month. This was an area many of us were unfamiliar with, so it was helpful to learn more about the work the enforcement team does and how it fits alongside the roles of other regulatory organisations.
The enforcement team helps protect biodiversity by ensuring environmental laws are followed thereby reducing habitat loss and species decline. Their work also acts as a deterrent to deliberate damage of valuable habitats and protected sites.
Colin outlined four main areas of enforcement:
- Wildlife Incident Investigation Service (WIIS): investigates suspected pesticide poisonings that harm wildlife or pets, whether deliberate or accidental.
- Sites of Special Scientific Interest (SSSIs): damaging or disturbing protected features of these sites without a licence is an offence.
- Wildlife licensing offences: involve the killing or disturbance of protected species such as bats, great crested newts and dormice, or damage to breeding sites. These cases may involve both Natural England and police wildlife crime officers.
- Environmental Impact Assessment offences: protecting uncultivated and semi-natural land from harmful agricultural activities. Land that has not been cultivated for over 15 years requires consent from NE before being brought back into use.
There was also discussion about the valuable role Wildlife Wardens can play within their parishes, as quick and accurate reporting is often crucial. Colin advised taking clear notes and photographs if an offence is suspected and reporting it to the appropriate authority. Getting familiar with any SSSIs in your area by using online mapping tools would also be valuable.
Thank you to everyone who attended, and especially to Colin for sharing his knowledge and experience with the group.
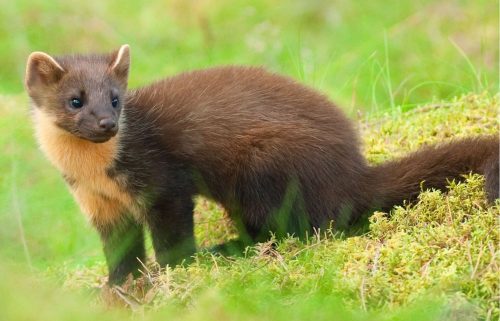
DWT Pine Marten Project: Looking for camera trap enthusiasts for a pilot scheme
Do you have your own camera trap? Do you have access to your own woodland or a garden that backs onto woodland?
The Devon Wildlife Trust Pine Marten team are trying to find some volunteers for a camera trapping pilot, and they thought of us! Is anyone up for it?
If you’re keen, email me and I will forward you further details. If you’d like to get involved but don’t have a camera, then there may be a couple available to loan.
Calling for your Wildlife Warden stories
If you find a spare moment over the festive period — perhaps after one too many mince pies, as a brief escape from family chaos, or as a small New Year’s task — we’d love to hear from you!
We’re updating our website and would like to include more of your personal stories about being a Wildlife Warden. These stories really bring the WW scheme to life, helping others understand what it’s like to be involved and why the role matters.
We’re not looking for anything long or fancy — just 10 or 15 minutes of your time. A few bullet points, a short paragraph, or even a single sentence is perfect. Whatever you feel like sharing, we’d be very grateful.
Please take a look here for a few prompts if you need inspiration. Thank you!
Dates for your Diary
| Wednesday 14th Jan 7.30pm (online) | Winter Collaboration Chats: Working with your parish council |
| Tuesday 27th January 7.30pm (online) | Winter Collaboration Chats: Behind the scenes at ACT WW |
| Tuesday 10th February 7.30pm (online) | Winter Collaboration Chats: Running a wildlife open garden event or competition in your parish |
| Monday 9th March 7.30pm (online) | Winter Collaboration Chats: Running a community bioblitz for your church/school etc. including moth breakfasts! |
Please email me if you are interested in coming to an event or would like to be sent a link for an online meeting.
Round up of Wildlife Warden activities across Teignbridge
Ashton WW Shira has been sharing her “Murder in the Garden” talk with Chudleigh Wild and a large local audience. The interactive talk explores how gardens can be healthy ecosystems, highlighting plants and wildlife we enjoy (and some we don’t!) and the impact of pesticides on the garden food web. Shira has also been preparing a document as an update about pesticides, which will be shared with wardens and local authorities in the new year.
Bishopsteignton There’s been lots happening here over the past few months, and WWs Sarah, Laura and Kirstyn have achieved so much. They are helping to develop signage about local bats for a parish council-owned site and have also begun transforming an old telephone box into a wildlife resource hub for the community. Sarah has also been planning a series of winter talks for the parish, and we look forward to hearing more about what’s coming up.
The team has been supporting the Parish Council and has become part of the recently formed “Climate Impact Action Group,” providing guidance and support. Their collaboration with the PC, alongside Andrew Rothery as part of the Pesticide Free Devon movement, has led to the fantastic outcome of the council declaring the parish pesticide-free. Here is the recent press release. What an achievement!
Bovey WW Janet has been working with swift enthusiast and WW Alistair Whybrow after getting a Wild About Devon grant for swift boxes. Three boxes have been installed at Make, ensuring all Grade 2 listed building regulations were met, and plans are underway to place two more at the Old Town Hall.
Chudleigh Welcome to new WW Clemence!
Dawlish Welcome to new WWs Kerry and Brian! The Dawlish Community Orchard team is gearing up for winter work on the site, while the WADE group continue their fantastic efforts along the Book, controlling the weir gates during heavy rain, clearing litter and debris, and welcoming not only the usual trout but also visiting salmon. WW Scott has some exciting plans for developing several micro forests in Dawlish – watch this space! WW Jerry, who runs the Devon Swift Project, continues to be incredibly busy and has been involved with an exciting community project in Buckfastleigh and Ashburton with funding from Riverford Planet Fund – find out more about this in Jerry’s blog. And finally, a huge congratulations to WW Sonia, whose incredible hard work has been recognised with a DWT Volunteer Award — well done, Sonia!
Dunsford WWs have continued their regular Teign Valley wildlife meetings, sharing local sightings and actions. At the last meeting, the group discussed the issue of hedgehogs often being killed on roads at village entrances, and Julia will be speaking to Dunsford School about children creating hedgehog awareness signs.
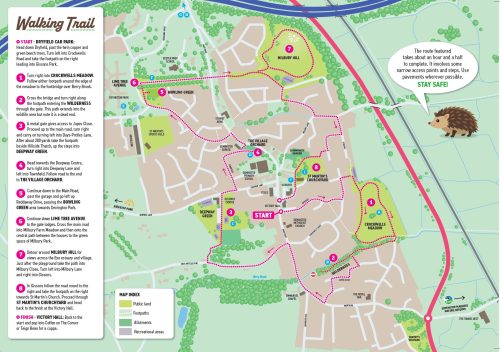
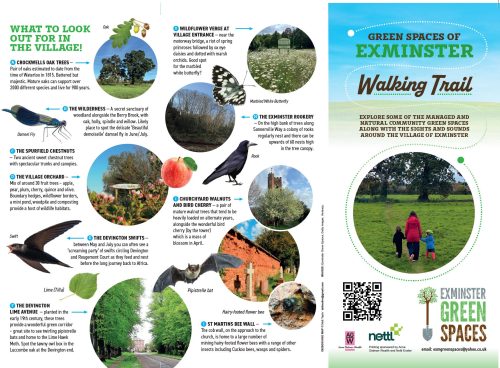
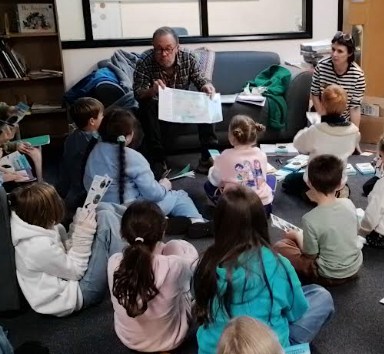
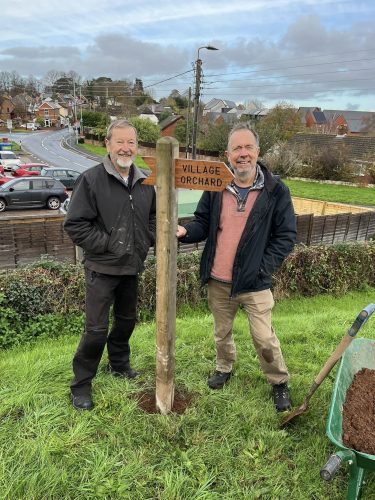
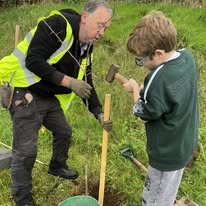
Exminster WW Jeremy and the Greenspaces team has been busy! They have recently released a revised Walking Trail map and leaflet which has been given to every child in the local primary school along with an introductory talk to the school’s Eco Team. In October, Jeremy gave a talk to the Parish Council on biodiversity duties under the Environment Act using the WW PowerPoint presentation as a starting point. A tree sapling was planted at a local residential home and 500 crocus bulbs with the agreement of Teign Housing, while a new fingerpost now guides visitors to the village orchard. Meanwhile, the Exminster Community Garden has grown, with two new sheds built thanks to a Parish Council grant, and an open morning is planned in January to celebrate its first anniversary.
Ilsington Welcome to new WWs Debbie and Nicky! WW Linda held a display stand at a recent community Christmas get together organised by the school PTFA. Linda’s display was all about creatures of the night and the kids enjoyed leaning more about bats hedgehogs, moths and creating a Moon garden. WW Dawn shared a summary of all the local walks she has led to date with the walk participants – a great reminder of the variety of places that have been visited so far. In October she led a final walk of the year to the DWT East Lounsten Nature reserve.
North Bovey WW Susan continues to be involved in a range of local surveys, including moths, river flies, butterflies and a meadow. She has also been helping with Himalayan balsam clearance and has joined a group working to rejuvenate the village allotments, hoping to add bird boxes, bug hides, wood piles and insect-friendly planting to the site.
Stokeinteignhead WW Jill organised a community talk with ecologist Kelvin Boot, who spoke about the “opportunities for wildlife in the village.” She was also asked to create a child friendly display board and event stand about local wildlife for a Christmas fair in early December – this has already helped build a connection with the local school, and Jill hopes to support them further next year. Meanwhile, WW Sam has been busy throughout the summer and autumn walking all the local footpaths, roads and byways to map and record the habitats and features of the parish.
Trusham WW Helen gave a talk to the local gardening club about how caring for the Trusham churchyard has become an immensely rewarding passion for her, with more and more species being added to the incredible list there – a whopping 688 invertebrates to date!
A huge thank you to everyone for your support and hard work throughout 2025 — our collective actions really do make such a huge difference across Teignbridge.
Wishing you a peaceful festive time and a Happy New Year, and looking forward to lots more events, surveys, plants, and bugs in 2026!
Vicky and Audrey