Category: Energy & Built Environment

  • Government releases its Hydrogen Strategy

    Government releases its Hydrogen Strategy

    Number 2 of the Government’s 10 Point Plan:

    “Working with industry aiming to generate 5GW of low carbon hydrogen production capacity by 2030 for industry, transport, power and homes, and aiming to develop the first town heated entirely by hydrogen by the end of the decade”

    On 17 August 2021 the department for Business, Energy and Industrial Strategy (BEIS) released its Hydrogen Strategy announcing, in the press release:

    • A ‘twin track’ approach to supporting multiple technologies including ‘green’ electrolytic and ‘blue’ carbon capture-enabled hydrogen production.
    • A UK hydrogen economy could be worth £900 million and create over 9,000 high-quality jobs by 2030, potentially rising to 100,000 jobs and worth up to £13 billion by 2050
    • Hydrogen could play an important role in decarbonising polluting, energy-intensive industries like chemicals, oil refineries, power and heavy transport like shipping, HGV lorries and trains
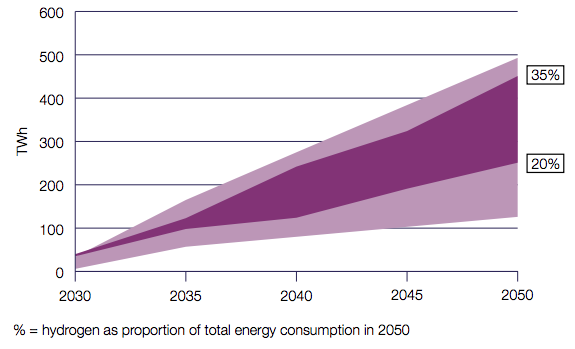
    • By 2050 20-35% of the UK’s energy consumption could be hydrogen-based.
    • A consultation to be launched, based on offshore wind, to look at ways to overcome the cost gap between low carbon hydrogen and fossil fuels, plus a consultation on a £240 million Net Zero Hydrogen Fund, to support the commercial deployment of new low carbon hydrogen production plants.
    • Working with industry to assess the safety, technical feasibility, and cost effectiveness of mixing 20% hydrogen into the existing gas supply.
    • £105 million in UK government funding provided to support polluting industries to significantly slash their emissions

    In the original press release, and elsewhere, it was mentioned that 3 million homes would be powered by hydrogen by 2030 but BEIS have now amended the press release and confirmed that this was an equivalent illustration and that hydrogen will predominantly be used in heavy industry.

    As stated in the strategy, with currently almost no low carbon production of hydrogen in the UK or globally, meeting the 2030 target will require rapid and significant scale up over coming years. It then describes where Hydrogen comes from:

    “There are almost no abundant natural sources of pure hydrogen, which means that it has to be manufactured. The most common production route is steam methane reformation (SMR), where natural gas is reacted with steam to form hydrogen. This is a carbon-intensive process, but one which can be made low carbon through the addition of carbon capture, usage and storage (CCUS) – to produce a gas often called ‘blue hydrogen’. Hydrogen can also be produced through electrolysis, where electricity is used to split water into hydrogen and oxygen – gas from this process is often referred to as ‘green hydrogen’ or zero carbon hydrogen when the electricity comes from renewable sources. Today most hydrogen produced and used in the UK and globally is high carbon, coming from fossil fuels with no carbon capture; less than 1% can be called low carbon. For hydrogen to play a part in our journey to net zero, all current and future production will need to be low carbon.”

    So in following its “twin track” approach the government assumes that blue hydrogen will initially start the strategy going with green hydrogen becoming more abundant (and cheap) in later decades. Without specifying proportions however, it seems that in both mix and, as shown below, use, the government is relying on the market to find the best combination.

    Some key points:

    Here is a graph from the report showing the estimated hydrogen demand in various sectors, in Terawatt Hours (TWh) (one Trillion Kilowatt hours), in 2030 & 2035.

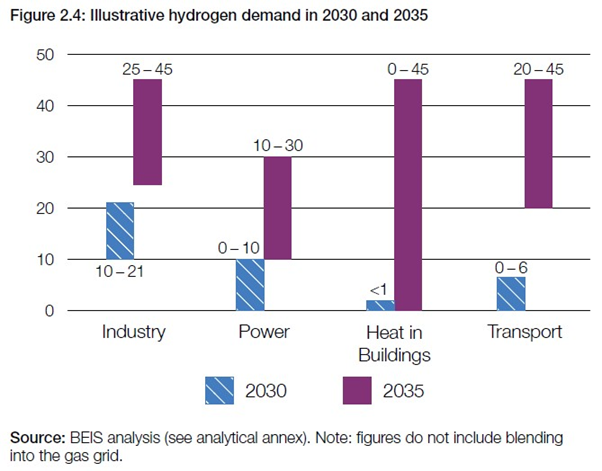
    Note in particular the 0-45 estimate for heating, this reflects the uncertainty about the lesser priority of hydrogen for domestic use and the availability today of alternatives, eg Heat Pumps. To put this into perspective the anticipated <1 TWh in 2030 and up to 45 TWh in 2035 represents about 0.2% and 10% respectively of the UK’s current energy demand for space and water heating.

    It’s likely therefore that, as mentioned in the Climate Change Committee’s (CCC’s) balanced pathway to Net Zero, hydrogen may play a part in heating where the housing is near to the hydrogen production and electrification is not possible or where there is stored hydrogen created from surplus renewable energy.

    Unless using this stored hydrogen however, it makes little sense to use green hydrogen for heating when the renewable energy used to create it would be better used to provide the heating directly and so save the wasted energy from conversion.

    It’s often quoted that “the only waste from using hydrogen is water”.  This is true when hydrogen is used in “fuel cells”, where a chemical reaction takes place, or where hydrogen is burned in pure oxygen but it is not true when, as would be the case with heating, it is burned in air. Air’s main constituent is Nitrogen and burning hydrogen in it produces other pollutants, known as NOx. The strategy considers these and how industry must ensure they are kept within emission limits, opponents however consider that, along with the infrastructure changes needed, it’s unacceptable to plan for any such emissions.

    As explained in an Annex, with an established battery electric vehicle industry now well established, cars and vans do not feature in transport assumptions, leaving the use of hydrogen for haulage, busses, rail, shipping and aviation however, given the rapid development in battery technology, the annex casts doubt over the likelihood of the first three. Consequently, as mentioned above, it seems the government will wait and see what the markets come up with.

    In 2050 the strategy estimates somewhere between 20% to 35% of the UK’s total energy demand being provided by hydrogen.  In the CCC’s 6th Carbon Budget report last year, its balanced pathway relied upon a maximum of about 20%. Until the government releases its own energy pathway it’s not possible to reconcile the two.

    As blue hydrogen relies on a supply of natural gas there’s suspicion outside government over its promotion as an energy source by the fossil fuel industry and studies, including this one in the USA, indicate that current production methods, including carbon capture and storage, result in significant CO2 and Methane (CH4) emissions, both in the extraction of the gas in the first place and then leakage in the capture and storage processes. 

    This view was reinforced by reports that Chris Jackson, the chair of the UK Hydrogen and Fuel Cell Association resigned in advance of the government’s strategy saying he could no longer lead an industry association that included oil companies backing blue hydrogen projects, because the schemes were “not sustainable” and “make no sense at all”.

    As mentioned above, in its twin track approach, the government sees blue hydrogen as useful in creating a path to green hydrogen but, with BEIS talking about up to 15 year contracts, concern has been voiced among climate groups that over-reliance on blue could lock the UK into decades of North Sea gas production, fossil-fuel imports and millions of tonnes of carbon emissions. 

    ACT’s view is that there will be a place for hydrogen in providing energy where electrification is not possible and in some industrial and chemical processes. With the uncertainties over the impacts of its production however and without scaled-up and effective capture and storage, blue hydrogen is wholly inappropriate as a solution and so efforts are better directed towards immediate reductions in the use of fossil fuels with any hydrogen pathway being primarily towards green hydrogen.

    Other relevant links:

    ACT’s Technologies to support Net Zero Section 3 Hydrogen

    The Telegraph Billions to be funnelled into hydrogen subsidies as UK races to hit net zero

    The Guardian Government reveals plans for £4bn hydrogen investment by 2030 

    BBC News Hydrogen power offers jobs boost, says government

    UKERC Pathway to net zero heating in the UK

    The Climate Change Committee Hydrogen in a low-carbon economy

  • Last Chance to Influence Where New Housing is Built

    Last Chance to Influence Where New Housing is Built

    You have until noon on Monday August 9th to give Teignbridge District Council (TDC) your views on the 100 plus sites around Teignbridge proposed for new development. If you don’t respond to this consultation you won’t get another opportunity. It is difficult, if not impossible, for plans to be changed further down the line.

    Government proposals for a new approach to planning rules will prevent even the local authority from making adjustments in response to changing circumstances in the future. It’s our last chance to influence where new homes are built. You may think your views won’t count. They definitely won’t if you don’t make them known. The more people who respond the better.

    The current Local Plan Part 2 consultation follows on from Part 1 in 2020, which focused on the policies that guide developments. The two parts will together form the Local Plan 2020-2040, which will replace the current Local Plan adopted in 2014.

    How to respond

    The consultation is online at teignbridge.gov.uk and is available chapter by chapter. You can comment using the online survey or the downloadable response form. The survey looks technical, but if you have local knowledge about particular sites it’s vital you share it. You can only comment on one site at a time and give comments in relation to eight criteria, although there is an opportunity to comment on “anything else”. You may want to prepare your comments before you go online and then copy and paste them in. Make sure you go all the way to the end of the survey, even if you don’t give all the personal information requested, and press the Submit button.

    The printable pdf form only asks for comments, with no prompts for specific criteria, but you have to print it out to use it or convert it from a pdf to a word document or similar.

    It is also possible to download the questions and send your comments by email to localplanreview@teignbridge.gov.uk or by letter to Spatial Planning & Delivery, Teignbridge District Council, Forde House, Newton Abbot Devon TQ12 4XX. All comments made in writing will be considered. 

    What to say 

    The number of homes proposed for each town or village is stated at the beginning of each ‘Housing Site Options’ chapter. If a town or village has several sites on offer, which together are able to more than cover TDC’s suggested housing numbers for the settlement, then stating in your comments which site/sites would be better is helpful. The suggested general comments below may be useful here.

    If you think your village has no allocated sites, make sure it hasn’t been included in Chapter 4 of the consultation, the Heart of Teignbridge. This is true for several proposed sites in Ogwell and Kingskerswell, for example. Check this map to see where all the proposed sites are. You will also need to look at Chapter 9, Employment Site Options, for land which may be developed for employment.

    If you have local knowledge of a proposed site, check the information given about it in the relevant consultation chapter for accuracy and omissions. If you have the time and inclination, it is also worth looking at TDC’s assessment of the sites in the appendices to the consultation. Appendix D(a) is for town sites while Appendix D(b) is for villages. To understand the scoring and colour coding for the sites, you will need to go to page 14 of the Stage B Report – Sustainability Appraisal (SA) and Strategic Environmental Assessment (SEA). To dig further into the scoring assumptions, check out Appendix A. You might need a stiff drink or two to see you through all this!

    Here are some examples of the sort of comments you could make on issues relating to wildlife:

    • It is essential that mitigation measures taken to protect wildlife habitats and avoid extinction of local species are completed before site clearance and building starts.
    • All the hedges around this site are biodiverse and should be protected and buffered.
    • A wide buffer strip is needed alongside the public footpath beside the stream, to ensure habitats are connected’.
    • Protect Greater Horseshoe Bat flyways and ensure there is no artificial lighting on the development.
    • Protect the nearby SSSI/ CWS (Site of Special Scientific Interest/County Wildlife Site) from polluted run-off from the new estate.

    These are more general comments you could make on the subject of climate change and greenhouse gas emissions:

    • New developments should be about meeting local needs in the most sustainable way. Delivering a pre-set number of housing units to boost the economy should NOT be the driver. 
    • Many of us nowadays live in one or two-person households, so the need is for smaller homes than the three to five bedroom houses typical of new developments. Building on a smaller scale would deliver lower greenhouse gas emissions as well as the housing numbers required. 
    • Greenhouse gas emissions for people living in urban areas in Teignbridge are typically 30% lower than for those who live in rural ones, as is true throughout the UK. The benefits of housing people within, or close to, urban areas are clear. The emissions associated with the provision of goods and services, as well as travel, can be minimised.

    You can find more information here.

  • An idea for the Heart of Teignbridge

    An idea for the Heart of Teignbridge

    The government demands that the local plan provides sites for about 750 houses per year over the next 20 years in Teignbridge.

    Where homes are built makes a difference to carbon emissions.

    If you build small flats in town centres:

    • There are fewer emissions from construction.
    • There are fewer ongoing emissions.
    • You don’t need a car, so there is a chance of no private transport emissions.

    This post considers how far this could be achieved in the Heart of Teignbridge using the sites already identified in part 2 of the local plan. It is quite a long post which includes some feasibility calculations, which considers:

    Overall allocation of sites in the plan

    Part 2 of the local plan identifies more new sites than are needed to meet this when sites already allocated in the existing plan are taken into account.

    The plan proposes that the allocations are split between the areas identified as follows:

    • Heart of Teignbridge: 40% (c. 2,920 homes)
    • Edge of Exeter: 24% (c. 1,800 homes)
    • Dawlish: 14% (c. 1000 homes)
    • Teignmouth: 1% (c. 100 homes)
    • Bovey Tracey: 3.5% (c. 250 homes)
    • Ashburton: 3.5% (c. 250 homes)
    • Villages: 14% (c. 960 homes)

    Each site has a suggested minimum and maximum number of homes, the following table is derived from these, and shows the level of choice in each area:

    The columns in this table are sourced from the local plan documents as follows:

    • Proposed distribution comes from ‘How much housing development is required’ in chapter 2.
    • Min is the sum of the lower number of homes for each site in the area, taken from chapters 3 to 10.
    • Max is the sum of the higher number of homes for each site in the area, taken from chapters 3 to 10
    • Min <= 1ha is the sum of the lower number of homes for each site in the area, where the site is less than 1 hectare (and so suitable for a smaller developer).
    • Max <= 1ha is the sum of the higher number of homes for each site in the area, where the site is less than 1 hectare (and so suitable for a smaller developer).
    • %required min is the proportion of Min that would be required to satisfy the proposed distribution.
    • %required max is the proportion of Max that would be required to satisfy the proposed distribution. This indicates the level of choice between sites given in the plan.
    • Notes are any observations.

    For the sake of argument let’s accept this distribution. It shows that there is a considerable amount of choice of sites in the Heart of Teignbridge, Dawlish, Bovey Tracey and the villages.

    The rest of this post considers a possible allocation for the Heart of Teignbridge.

    Allocation in the Heart of Teignbridge

    Within the Heart of Teignbridge the sites are subdivided into Urban Renewal sites, which are on existing land that has already been developed for other purposes, and the rest of the Heart of Teignbridge.

    Enough of the sites in the Heart of Teignbridge to meet the allocation of 2920 are shown in the following table:

    Some of the sites towards the bottom of the table have been chosen to make up the numbers, but this allocation tries to avoid using green field sites that are away from current development.

    This post considers putting the maximum possible amount of development into the Urban Renewal sites, this has a number of advantages:

    • The homes delivered will all be within easy walking distance of:
      • Newton Abbot Station
      • Bus services
      • Newton Abbot town centre
      • The combined cycleway/footpath towards Bovey Tracey and Moretonhampstead to the north, and currently to the Passage House, soon to be extended to Teignmouth.
      • Hackney marshes
    • The need for car ownership for day to day use would be minimised:
      • occasional car use could be provided by a car club.
      • Day to day car use would only be needed if work demanded it.
      • The need for further car parking would be minimised.
      • Car traffic growth would be minimised.
    • These sites suit smaller dwellings and these is a proven demand for smaller dwellings.
    • The combination of smaller dwellings and possibilities for active travel and use of public transport will give the smallest carbon footprint.
    • Development of green field sites further out away from the centre is minimised.

    We then consider other sites as near to the Town Centre as possible. The A382 development is already in progress, and there is relatively level access to the town centre along this corridor. This favours the Berry Knowles, Caravan Storage and Forches Cross sites. Unfortunately we still need to find 424 homes from the remaining sites.

    Housing Need

    The latest TDC housing policy document states that there is a waiting list of about 1000 applicants, and that 51% of these applicants are looking for a single bed property the proportion of property types required by applicants is shown in the following table:

    Additionally 1 in 3 Teignbridge residents is over 65 years old, so probably doesn’t have children.

    This says that there is a need to smaller properties, which could be flats.

    There is clearly a need for social and affordable housing, as the waiting list recently has been about 1000 applicants, with about 350 applicants being housed each year. If the waiting list were to be substantially reduced over say 4 years to 100, then an additional 225 affordable homes per year would be required.

    On average 137 new affordable homes are provided, other applicants are housed from existing stock. So the number of new affordable homes needs to increase to about 425. That would leave 325 open market homes from the obligatory 750 allocation.

    Housing Density

    Housing density is expressed in dwellings per hectare (dph), the area part of this measure includes estate roads, but excludes major thoroughfares.

    The Teignbridge Urban design guide gives suggested densities for different situations:

    From the developable area and maximum homes stated for Urban Renewal areas we can calculate the maximum dwellings per hectare:

    Kingsteignton retail park site has a maximum density of 37.04, which is low for an urban area. This is a large site, so makes a big difference to the overall numbers, developing this at 50dph delivers an additional 175 homes.

    If all the sites were developed at a density of 70 dph, then only 522 more homes would be required, so only the Berry Knowles and Forches Cross sites would be needed in addition to the Urban Renewal sites. Some sites are already allocated at more than 70 dph, so setting this as a minimum gives 2466 homes, so we are left with 454 to find.

    If a minimum of 84.5 dph was set over this area, then 2932 homes would be delivered, which is enough to satisfy the Heart of Teignbridge allocation.

    When I originally wrote this section I has misread the developable area of Brunel as 22 hectares, which makes the calculations better. If the developable are of Brunel or Kingsteignton retail park could be increased by 7ha between both sites, then the average density required overall could be reduced to 70dph.

    What does 70 dwellings per hectare look like?

    The following pictures are from the TDC Urban Design Guide:

    So the Teignmouth block to the top left is at 70 dph. These examples are in the Teignbridge Vernacular. For a larger development such as Brunel, a complementary, but more modern style might be appropriate.

    Consider the following example from the paper on housing density from Havant council:

    I am sure that an imaginative architect could manage better!

    So it looks like 70 dph is achievable if most dwellings are small and development is up to 3 storeys.

    What should the housing mix be?

    In order to substantially reduce the housing waiting list we need to deliver about 425 affordable homes per year. The mix for these should follow the mix of dwelling sizes required by applicants. If the urban renewal area were developed using this mix then the numbers would be as follows:

    Here we have split 2 and 3 bed dwellings equally between flats and houses.

    What would be the carbon footprint of this development be?

    The carbon footprint that can be attributed to this development is made up from:

    • Embedded emissions from construction of dwellings.
    • Operational emissions from buildings in use.
    • Transport emissions

    For buildings emissions can be approximately calculated from floor area, we assume that development is to the minimum space standard introduced in 2015. This standard takes into account the number of occupants as well as the number of bedrooms, so a one bedroom flat may have one or two occupants. Apply the minimum floor areas in this standard to our required annual housing numbers:

    Embedded emissions from construction depend on the construction type, the following values are assumed, and are applied to a floor area of 45969 m2:

    CLT stands for cross laminated timber, which is a lightweight construction that can be used for up to 9 storeys. It lends itself to offsite pre-fabrication. CLT panels have good thermal properties.

    The above embedded emissions do not take account of sequestration caused by the carbon sequestered whilst trees are growing being locked up in the structure of a dwelling. If this is taken into account it could be that CLT construction is carbon negative.

    The operational emissions can be approximated from past energy performance certificates, combined with an aspiration that the new building regulations will reduce operational emissions to 25% of current building regulations. The average current CO2 emissions from properties with an EPC rating C and above since 2015 is about 24kg CO2e/m2/year. So we assume that these dwellings will be built to 6kg CO2e/m2/year. This gives operational emissions of 276 tCO2e per year.

    As no car travel is necessary with these sites, there are no additional transport emissions.

    If the urban renewal sites are built at 750 dwellings per year, it will take nearly 4 years to construct these dwellings. If we allocate embedded emissions to the year of construction, then the total emissions over the first few years would be:

    Comparison with development of more out of town sites

    Suppose that instead we built 750 brick built 3/4 bedroomed homes on sites 3 miles from the town centre.

    Assume these have an average floor area of 100m2, then the embedded emissions would be 73.1 tonnes per house, or 54,825 tonnes for 750 houses.

    The operational emissions would be 450 tonnes per year.

    We assume that a resident 3 miles from the town centre travels everywhere by car including travel to work, shopping and leisure. This might amount to 8,000 miles per year. Worse sites 3 miles from the town centre are generally at a higher altitude, so will require additional energy to go uphill that is not regained downhill. 8,000 miles in an average petrol or diesel car emits 2.5 tCO2e/year, and a diesel 2.2 tCO2e/year. Even an EV powered from grid electricity would emit 0.8tCO2e/year. If we assume 20% EV, 40% diesel and 40% petrol, then the average car would emit about 2t CO2e/year.

    Even if we assume 1 car per house, then there are an additional 1500 tonnes from cars. It would be more realistic to assume 2 cars with one being used less, so effectively 1.5 cars.

    Putting all this together for the first few years we get:

    Once built this option has nearly 10 times the emissions than the alternative low carbon option.

  • Site options for the Teignbridge local plan to be consulted on

    A meeting of the council executive on 1st June passed a motion to run a public consultation on site options for the local plan from 14th June to 9th August.

    Executive Committee meeting

    You can watch the proceedings of the executive committee here , this gives access to a recording of the whole meeting, the local plan is item 6 on the agenda, which you can select from the menu on the right.

    Jackie Hook said “We will have to choose some sites, help us to choose the least damaging. This isn’t however about who can gather the biggest petition against a site, this is about bringing to the council’s attention additional planning related information and knowledge.”

    Local plan consultation on sites

    Part 2 of the local plan has now been published and can be found here.

    Housing Numbers

    As you may know, the Government has told Teignbridge it must build 751 houses a year (they had planned to order 1,532 houses a year!). The council therefore has to identify the sites where the houses can be built. If we do not do this the Government will take over planning at Teignbridge and increase the numbers by 20%.

    This consultation asks that members of the public help by:

    1. Checking through the sites and see what may be proposed in your community and commenting about the sites.
    2. Sharing the consultation with your friends and family living in Teignbridge. It’s really important as many people as possible know about the proposals and say what they think to Teignbridge.

    This could well be the last time local people are given a say in major planning decisions like this.
    The Government is proposing to bring in a new system under which land will be zoned. Anything designated for ‘growth’ will be deemed to have ‘planning permission in principle’.
    Government ministers claim their plan will eliminate ‘red tape’ but many fear that it abolishes any meaningful involvement of residents and local councils in planning matters.
    The consultation on the possible housing sites ends at 12 Noon on Monday 9th August 2021. Do please have your say 

    Low Carbon

    Chapter 11 states Teignbridge’s 2018 carbon footprint and analyses emissions trends over the period 2008-2018, showing that the transport, buildings, agriculture and waste sectors have not reduced over that period.

    Electricity consumption is estimated to grow from 468GWh to 940GWh (101%) as a result of electrification of heat and transport, as well as growth associated with growth mandated by the plan.

    The report doesn’t give any detail of how this electrification will be achieved, but the proposed increase in electricity consumption is close to our own estimates based on widespread EV take-up and retrofitting the existing housing stock to near Passiv Haus standards. Indeed the growth in electricity demand is slightly lower than we estimated, so some other demand reduction must be assumed.

    Possible sites are identified for 217GWh of wind and 726GWh of solar, totalling 953GWh. So on a whole year basis enough to meet demand. The report identifies a number of constraints, which mean that this much renewable generation is unlikely to be buildable.

    Peak demand occurs in the winter, when solar generation is producing least. We see already that in the recent sunny period that grid carbon intensity for the South West can get as low as 30g/kWh when most energy comes from solar and nuclear. Contrast this with winter when on a calm day most of our electricity in the South West comes from gas when grid carbon intensity can exceed 400g/kWh.

    The report identifies an increase of 201GWh of demand from heating, which will mainly be needed in the winter months. It also identifies 49 GWh from additional housing, if we assume that this will also be biased towards winter, the additional winter demand could increase to 230GWh. This is more than could be supplied by the identified wind resource. So Teignbridge will need to import more renewable energy from elsewhere during the winter.

    A large amount of land is identified as suitable for solar development. Here there is also scope for a significant contribution from rooftop PV, however, this is limited in practice by the ability of local substations to deal with local generation.

  • Fast Access tool for planning applications

    We have written a tool which enables you to see details of all active planning applications on a single interactive page. This enables applications to be filtered by date range, parish, ward or Wildlife Warden area, type, decision level. Text search on address, proposal and document description and title is also provided.

    A summary of each application is shown with reference number and proposal, this can be expanded to show all details and the latest documents relating to the application. There are links from the reference number to the application on the TDC site, as well as to the documents page for the application.

    A full description of the application is here.

    The tool is available here.

    Some filters have been preconfigured:

  • Wood burning stoves and air pollution

    Wood burning stoves and air pollution

    Wood burning stoves are in the news. They make a significant contribution to air pollution according to a recent government report. Wood burners and open fires together account for more than one-third (38%) of the tiny particles known as PM2.5 that are among the most damaging types of emissions for human health. That is more than any other source. Road traffic, by contrast, accounts for only 12%.

    I’m not sure what to make of this. I like to fire up our stove on cold days, to supplement the oil-fired central heating, and we are thinking of adding a second stove elsewhere in the house to reduce our reliance on oil. Surely it is better to burn wood than fossil fuels? 

    Well it’s not that simple. Wood is a renewable energy source as burning it is carbon neutral and doesn’t increase carbon dioxide emissions. But those PM2.5 emissions are a problem, both inside and outside the home. Open fires are worse than burners on that front, but many burners with doors are poor too. A recent study by the University of Sheffield showed that people who open the door to load a stove twice or more in an evening are exposed to pollution spikes two to four times higher than those who refuel once or not at all.

    The problem is compounded by burning the wrong type of wood. Emissions from wood treated with chemicals or containing glue are seriously carcinogenic. Wet wood is also more polluting because it produces more smoke. A ban on sales of wet wood for households came into force in England in February.

    Biomass boilers tend to be less of a problem than wood burning stoves, especially those that burn wood pellets. They are also more an informed choice than a nice-to-have accessory as you can’t sit around them enjoying the comforting warmth and glow.

    I’m happy to take the indoor pollution risk of using a wood burner. But what about the particulates escaping up the chimney? Is air quality in Newton Abbot affected by that? Judging by a pollution map based on the National Atmospheric Emissions Inventory, the answer is yes. Domestic wood burning is the biggest source of air pollution due to PM2.5 in all the local towns.

    This surprising fact has to be seen in the context of the huge reduction in air pollution over the past 50 years and the way the government measures it. Annual emissions of PM2.5 have fallen by 80% since 1970, mainly due to the falling use of coal and higher emission standards for transport and industry. The decline has levelled off in recent years though, as decreases in emissions from some sectors are largely offset by increases in emissions from domestic wood burning and use of biofuels by industry.

    Wood burning stoves have become fashionable in recent years. They have also become more efficient and less polluting (in terms of outdoor pollution at least). The government’s report assumes stoves in use are mostly of the old polluting type, and that they are being used for 40 hours a week in winter and 20 hours a week in summer. This is based on a 2015 survey that also forms the basis of the NAEI. The government admits its estimates could be wrong by a factor of 10, so wood burning stoves could be making a much smaller (or larger) contribution to air pollution than the 38% attributed.

    Whatever the numbers, Gary Fuller, an air pollution scientist at Imperial College and author of ‘The Invisible Killer – the rising global threat of air pollution and how we fight back’, is clear that burning wood, especially as a fashion statement, is not acceptable. In an interview with Environmental Protection Scotland he said even stoves that meet the eco-design standards that will apply from 2022 “emit the same amount of particles as the emissions from six heavy goods vehicles”.

    That doesn’t sound like a neighbourly thing to do, even in my semi-rural village. In a city, it is definitely hard to justify when we know that air pollution is a killer. So my search for a clean alternative to burning oil to heat my house is leading in the direction of a heat pump, although that will be more expensive to install and run than another wood burning stove. If I was a more cynical person, I would suspect this demonisation of wood burning stoves to be a campaign aimed at prolonging our reliance on fossil fuels. That’s just mad though, isn’t it?

  • Heat pump pros and cons

    I remember as a student putting a shilling (2.5p) in the meter to run one bar of an electric fire for an hour to heat my single room. The heat was soon lost again due to poor insulation. 

    I now live in a large house heated to a steady 21C by an air source heat pump that uses less energy per hour than the one bar fire did to heat a single room, even in cold weather. It also heats water twice a day to 55C. 

    Our heat pump works by extracting heat from the air outside and using it to heat water,  which then circulates through the underfloor heating system. This works well because the floor area radiating heat is much larger than traditional radiators, so the circulating water does not need to be as hot as in a conventional system. The key point is that the electrical energy needed to run the pump is much lower than the heat energy it provides.

    Many households will need to replace their gas or oil boilers with heat pumps if we are to have any chance of reaching the government’s net zero carbon target by 2050. Heating accounted for nearly one third of UK household greenhouse gas emissions in 2017, according to the Energy Saving Trust. We need to cut heating emissions by 95% to reach net zero by 2050, it says.

    So far we have made little progress. Currently, biomass is the main source of low emission heat in British homes, primarily supplied via wood burning stoves. Around 1 million homes make use of this energy source, according to the Climate Change Committee, which advises the UK government. Heat pumps account for fewer than one in 100 sales a year of heating systems and show little sign of becoming more popular.

    Part of the problem is that heat pumps work best in houses that are well insulated and airtight. That makes them a good choice for new build houses. My house, for example, was built 10 years ago and designed for maximum energy efficiency. It is an oak framed building with insulated wall and roof panels, underfloor insulation and triple glazed windows. Plus solar panels and the heat pump. It has an Energy Performance Certificate rating of A and is as airtight as possible while still being well ventilated.

    Installations in older buildings are possible but it is important to obtain a professional whole house heat loss calculation so that the heat pump and radiators or underfloor heating are correctly sized. If this is not done a heat pump may not work well. 

    It is likely you will have to improve your home’s insulation before you can install a heat pump, but this is an investment worth making however you decide to heat your home. It will reduce your energy use, which is the first step to decarbonising your home.

  • My Carbon Footprint

    My Carbon Footprint

    See the source image

    I was brought up to turn the lights off when I left a room, to save both money and energy. I remember the three day week of the 1970s and the power cuts when energy was rationed. That early training may help me now as I start the work of making my home more energy efficient.

    I knew when I bought my home three years ago that I would need to do this eventually as it came with an energy performance certificate rating of E, which is pretty bad. Then recently, I checked out some of the carbon footprint calculators you can find online. This was partly for my own interest and partly because my parish council has declared a climate emergency, and as a councillor, I thought I should look at my own carbon emissions. Well, that didn’t go well!

    I don’t fly much and aim to keep it that way, so I score points there, and although I drive an old diesel car, I don’t drive it very far. (The electric bike we bought this year is doing increasing mileage!) The main problem is household consumption of electricity and heating oil, which accounts for nearly 40% of my total footprint. It makes my energy bills high too.

    The first step in trying to reduce that is to find out which household appliances are the greediest in energy terms. I have borrowed a couple of meters to help with this and am gradually working through the house. Most of my appliances are quite old, so it may be worth replacing some. Even though a new fridge freezer, for example, comes with embedded emissions from the manufacturing process, it’s greater energy efficiency (and lower running costs) may make it a worthwhile purchase.

    Next is an assessment of where the house leaks heat, which will hopefully help me decide what I can do to improve this. More or better insulation may be called for, or perhaps I can start thinking about whether to install a heat pump and retire my oil-fired boiler. I might be able to apply for the government’s Green Homes Grant to help with costs, or the Renewable Heat Incentive. 

    It’s a steep learning curve and I will need help along the way to make sensible decisions. It has opened my eyes, though, to the importance of economising on energy wherever possible. It might help my bank balance too. A win win in fact!

  • New Government Proposals impose 1532 houses a year on Teignbridge

    New Government Proposals impose 1532 houses a year on Teignbridge

    The government is conducting a consultation entitled “Changes to The Current Planning System”, which include proposed changes to the formula for calculation of housing numbers.

    When applied to 2020 this formula requires 1532 houses a year, whereas the previous formula required 760 houses.

    Summary of our concerns

    • The absence of parallel policies to limit the significant increase in GHG emissions goes against the UK’s Paris commitments on Climate Change
    • Extrapolating historic growth to predict future demand is unsustainable, unrealistic and unnecessary
    • Undue weight is given to workplace affordability now and 10 years ago
    • The Workplace Affordability Criteria proposed is likely to build houses in the wrong places and increase commuter miles
    • Workplace affordability does not take into account the major projected growth which is in pensioner households.
    • The assumption that house prices are simply determined by supply/demand is misguided
    • Imposing significant government targets to the housing market without safeguards or limits is likely to exacerbate boom/bust cycles
    • A rushed consultation for a policy change with significant impact on some local communities

    What is the formula

    The formula is calculated from:

    An annual baseline is set by dividing the growth in household numbers over 10 years by 10.

    This baseline is multiplied by an adjustment derived from workplace affordability and the difference between workplace affordability now and 10 years earlier.

    The formula is designed to add at least 300,000 new houses per year in England.

    Full details of the formula and a worked example are given in our detailed paper.

    Growth in household numbers

    This image has an empty alt attribute; its file name is image.png

    ONS project a 7,920 growth in Teignbridge household numbers between 2020 and 2030. The chart on the right shows that the majority of these will be pensioners. Of those who are of working age it is likely that a significant proportion will be commuters.

    Growth of 7920 over 10 years gives an annual baseline of 792 houses.

    Workplace affordability

    Workplace affordability is median house prices divided by median workplace earnings. So is a measure of the relationship of house prices in Teignbridge to pay in Teignbridge. The following chart shows the workplace affordability now and 10 years ago over the last few years:

    Both now and 10 years ago affordability has been falling, which means that houses are becoming more affordable. 10 years ago we were recovering from a financial crisis and in 2010 after the general election the housing market stalled, causing a low in house prices and so affordability.

    The government’s stated purpose in to have a formula which is reactive to deterioration in affordability in areas that are growing, such as areas of the Northern Powerhouse. Comparison with 10 years ago in this case fails because slight changes now are dwarfed by big changes 10 years ago.

    The adjustments calculated using affordability over the last few years are shown below:

    The adjustment varies considerably from year to year and does not have to have a relationship to recent changes in availability.

    As many worker commute out of the district and the majority of household growth is in the older non-working population, we don’t think that workplace affordability is an appropriate measure.

    Age based affordability

    We have calculated affordability for pensioners aged under 75, and those aged 75 and over, based on median gross incomes for England. Currently pensioner incomes in the South West are higher that nationally:

    This suggests that affordability for older pensioners is about the same as for the working population, but affordability is substantially lower for younger pensioners. This only considers earnings, it does not consider the larger capital resources that pensioners can have in housing, pensions and other investments.

    Residential Affordability

    Residential earnings are the earnings of residents of a district.

    Residential affordability is median house price divided by median residential earnings.

    ONS also publish median residential earnings for each financial year, so we can compare median residential and workplace earnings.

    Residential earnings for Teignbridge are consistently higher that workplace earnings.

    Comparison with Exeter

    We have also considered the relationship of residential and workplace earnings in Exeter, and see an opposite relationship:

    Here residential earnings are lower than workplace earnings, though recently the two have converged.

    The effect of using residential earnings, rather than workplace earnings would be to make affordability lower in Teignbridge, and in earlier years higher in Exeter. This would result in more houses in Exeter and fewer in Teignbridge.

    This would mean that more people who worked in Exeter lived in Exeter, so there would be less commuting, which would be likely to be by car.

    What has this to do with climate change?

    When a traditionally built house is constructed there are about 60tonnes of Carbon Dioxide equivalent (t CO2e) of Green House Gas (GHG) emissions. Building 1532 additional houses would cause embedded emissions of 93kT CO2e which is about half Teignbridge’s domestic emissions of 182kT CO2e (for 2018). On this basis the previous formula’s 760 houses would have emitted 46kT CO2e.

    We have also demonstrated that using residential earnings would lead to more homes being built in areas with high earnings, which would lead to less commuting.

    In 2018 road transport emissions for Teignbridge were 402 ktCO2e of which 329.8 ktCO2e were on A roads and motorways. These roads account for 45% of all emissions produced in Teignbridge.

    The following map shows these emissions allocated according to traffic flows in the road network in Teignbridge.

    An interactive version of this map can be found here.

    Are 300,000 houses per year needed

    ONS project that between 2020 and 2030 1.6 million households will be formed in England, nowhere near 3 million.

    The consultation says: “The Government has based the proposed new approach on a number of principles for reform. These include ensuring that the new standard method delivers a number nationally that is consistent with the commitment to plan for the delivery of 300,000 new homes a year, a focus on achieving a more appropriate distribution of homes, and on targeting more homes into areas where they are least affordable.” 

    So the new standard method for calculating housing numbers takes into account existing housing stock, as well as projected household growth. It also puts more emphasis on affordability by taking into account changes over time, and it inflates the final number by removing the 40% cap that currently applies.

    Building 300,000 houses a year, rather than 160,000 means that 140,000 extra houses will be built. Using 60t per house, embedded emissions from these additional houses will be 8.4Mt , UK GHG emissions in 2019 were 351.5Mt, so this is unnecessary housebuilding could add 2.4% to UK emissions each year.

    It would be better to reduce new housing numbers, and divert building trades resources to retro-fitting existing buildings so that these are as energy efficient as possible.

    Research by the UK Collaborative Centre for Housing Evidence provides an alternative, and in our view more plausible explanation of the causes. Housing evidence has calculated that there were 1.12million surplus houses by March 2018, and that taking this into account net additions to housing stock exceed household formations.

    In Teignbridge, since compatible records began in 2001, 497 houses have been completed than households formed. In addition there have been changes of use, conversions and retrofits that have effectively increased the housing stock, that are not counted in new build housing numbers.

    In Teignbridge it is doubtful that building more houses will have much effect on affordability, because the majority of new housing that is built is out of reach for people on Teignbridge median earnings, and will mainly be bought by people whose income comes from outside the district. If house prices were to drop such that development was unprofitable, developers would just stop building and wait for the situation to correct.

    We agree that tackling some of the other causes would be more effective:

    • Privatisation of council housing
    • Relaxation of restrictions on buy to let mortgages
    • Low median incomes
    • The lack of income progression recently in early careers.
    • Difficulty of accessing mortgage finance.
    • Competition with buy-to-let landlords.
    • Speculative purchase of housing as an investment asset, particularly by foreign buyers.

    Unfortunately the government is intent on building 300,000 houses a year, so the consultation doesn’t offer much opportunity to comment on that.

    Timetable for Teignbridge Local Plan

    The consultation gives a tight timetable for submission of part 2 plans in order to be exempt from these requirements.

    The current timetable for the Teignbridge local plan can be found here https://www.teignbridge.gov.uk/planning/local-plans-and-policy/local-development-scheme/

    This starts development of part 2 of the plan in January 2021, and consults on sites in the period leading to September 2021. This plan is then submitted for inspection in April 2023. If the new formula is adopted by the end of 2020, then in order to be exempt from the new requirements, the council will have until September 2021 to submit a plan to the inspector. This sounds like an extremely challenging contraction of the planning process.

    It is therefore likely that TDC will be obliged to comply with this formula, and so will need to identify additional sites, which will extend the plan timetable further.

    Detailed Analysis

    Our in depth analysis can be found here

    Responding to the consultation

    You can respond online to the consultation here.

    The deadline for responses is 11:45pm on 1st October 2020.

    Our response to the housing numbers part of the consultation is available here , and has been submitted online.